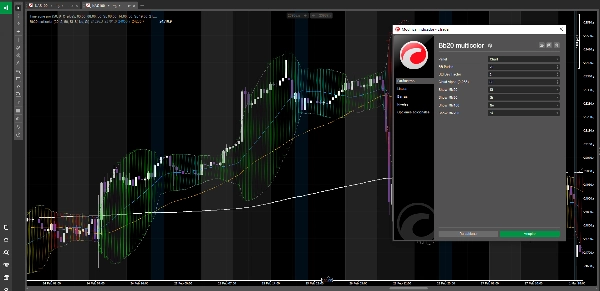
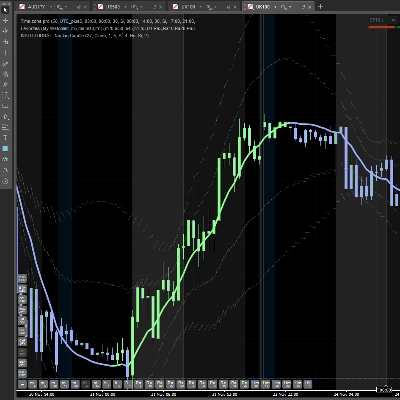
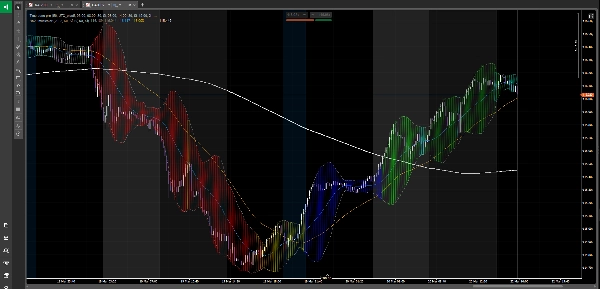
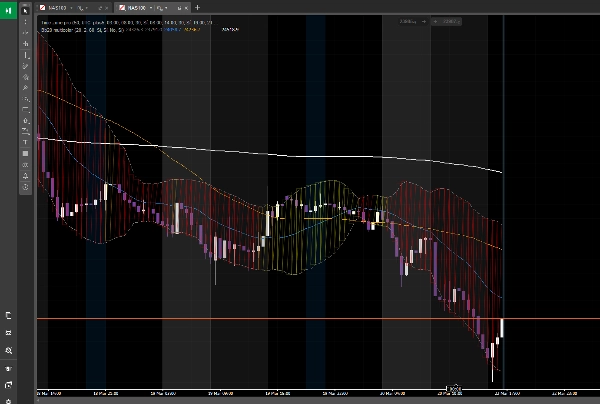
00
Days
:
00
Hours
:
00
Minutes
:
00
Seconds
Bb20 multicolor
指标
2 下载
版本 1.0, Mar 2026
Windows 版、Mac 版
"Bb20 multicolor" 已上传图片"Bb20 multicolor" 已上传图片"Bb20 multicolor" 已上传图片
注册日期 24/02/2025
10
销售
1.29K
免费安装

BB20 Multicolor


A powerful market cycle identification indicator that overlays directly on your chart, color-coding price action across 8 distinct market states — from deep bearish to fully bullish — using the relationship between price and four key moving averages (MM20, MM50, MM100, MM200) combined with Bollinger Bands.


──────────────────────────

HOW IT WORKS

──────────────────────────


The indicator constantly evaluates the position of price relative to the four moving averages and assigns one of 8 colors to the Bollinger Band cloud zone, giving you an instant visual read of the current market cycle stage:


🔴 RED — Clear bearish trend

Price is below MM200. The market is dominated by sellers. Bias: short only.


🟠 ORANGE — Technical bounce

Price is below MM200 but has recovered above MM20. A bounce within a bearish trend — not a reversal. Common bull trap zone.


🟡 YELLOW — Cycle phase 1

Price has crossed above MM50 but moving averages are still bearish. First signs of recovery, not yet confirmed.


🔵 BLUE — Trend reversal attempt

MM100 and MM50 are below MM200, but price is starting to climb between them. High volatility transition zone — watch closely.


⬜ GRAY — Neutral / weakening

Price is above MM200 but below MM100. The long-term structure is still bullish but momentum is fading. Caution zone.


🟢 LIME GREEN — Cycle phase 2

Price and MM50 are above MM200. A new bullish cycle is being confirmed. Many institutional traders begin positioning here.


🪵 TEAL — Healthy consolidation

Price is above MM200 and MM100 but pulling back toward MM50 or MM20. A normal pause within a bullish trend — potential re-entry zone.


🌲 DARK GREEN — Mature bullish cycle

All moving averages fully aligned: MM200 < MM50 < MM20 < Price. Cleanest trending environment. Minimum resistance to the upside.


──────────────────────────

FEATURES

──────────────────────────


• Cloud zones rendered natively with cTrader's Chart.DrawTriangle for smooth, professional-looking fills

• Bollinger Bands (upper and lower) displayed alongside the cloud

• All four moving averages individually toggleable (MM20, MM50, MM100, MM200)

• Configurable BB period, standard deviation factor, and cloud transparency

• Works on any instrument and any timeframe

• Fully open source — free forever


──────────────────────────

HOW TO USE IT

──────────────────────────


1. Use the color as a market context filter before taking any trade

2. Only look for longs when the background is green (lime or dark)

3. Only look for shorts when the background is red or orange

4. Use yellow, blue, and gray as transition zones — reduce size or wait for confirmation

5. Teal is your re-entry zone in an established bullish trend


Compatible with any trading strategy. Particularly effective when combined with price action, volume analysis, or sentiment-based approaches.


Install it, drop it on your chart, and instantly know what phase the market is in.

⚠️ RISK DISCLAIMER


Trading financial instruments involves risk and is not suitable for everyone. Always do your own analysis, manage your risk carefully, and never trade with money you cannot afford to lose.


This indicator is a technical analysis tool — not financial advice. Use it wisely.

0.0
评价:0
客户评价
该产品尚无评价。已经试过了?抢先告诉其他人!
Signal
Bollinger

该作者的其他作品

指标
Indices
Forex
+1
Order block
指标
Indices
Stocks
+2
PREMIUN INDICATOR
指标
Indices
Breakout
+3
FREE Global Trading Sessions Indicator
指标
NAS100
Indices
+3
volumen perfile
指标
Indices
Forex
+1
Super Arrows
指标
Indices
Stocks
+3
Perfect Trend
指标
Indices
Stocks
+2
Daily Fibo
指标
Indices
Prop
+7
ICT Order Block Advanced
指标
Indices
Commodities
+2
HTF Candle
指标
Indices
Commodities
+4
Zone Pulse Rank
指标
Indices
Forex
+3
INSTITUTIONAL Nonlag Candle
指标
Indices
Stocks
+3
EMAScalpHistogram

猜您喜欢

指标
NAS100
NZDUSD
+16
Draw a rectangle, label it RRL or RRS. Instant position size, risk, reward targets and full R:R breakdown.
指标
NAS100
NZDUSD
+13
Smart Money Suite (Lite): BOS, CHoCH, Swing structure, PDH/PDL & session killzones. Essential SMC tools, zero clutter.
指标
Indices
Prop
+4
Randomly displays trading quotes for 30s followed by a hidden break. Keeps charts clean while boosting trader mindset.
指标
Indices
Commodities
+1
Visualize higher timeframe candles directly on your current chart. Display up to 3 higher timeframe panels with OHLC
指标
NAS100
NZDUSD
+15
Engulfing Candle Indicator Pro
指标
Grid
Indices
+4
A free institutional-style chart tool that maps key daily liquidity levels in a clean H Capital interface.
指标
NAS100
NZDUSD
+26
Smart Money Heat Dashboard Pro is a professional-grade cTrader / cAlgo indicator designed to help traders read markets.
指标
Grid
NAS100
+6
RiskLotSizer is a practical risk management indicator for cTrader that helps traders calculate lot size based on a chose
指标
NAS100
Indices
+7
Multi-timeframe moving averages with session lines for structured trend analysis directly on the chart.
指标
Grid
NAS100
+19
Fixed Range Volume Profile - TradingView Style (POC, VAH, VAL)
指标
NAS100
NZDUSD
+7
Trading Concept Suite: OBs, FVGs, Structure, Liquidity, Killzones & MTF overlay. Every concept in one cTrader indicator.
注册日期 24/02/2025
10
销售
1.29K
免费安装