
说明
VOLUME HEATMAP PRO - 专业市场密度可视化
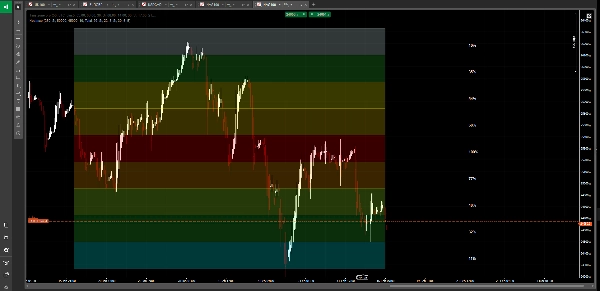
通过这款先进的成交量热力图,以前所未有的方式观察市场,将复杂的成交量数据转化为直观的视觉展示。与传统仅在图表底部显示柱状图的成交量指标不同,Volume Heatmap Pro 精确揭示了机构交易者在每个价格水平上的建仓和分仓位置。
主要特点:
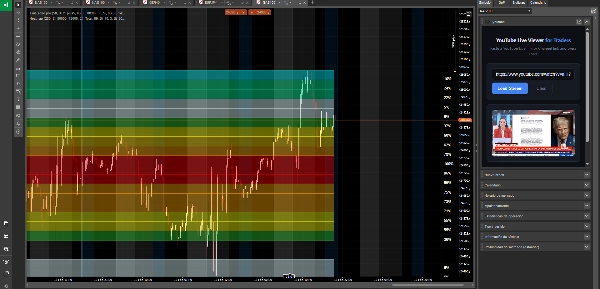
🔥 动态色彩编码热力图
通过惊艳的10级色彩渐变系统体验成交量分析。从冰蓝色(活动最少)到炽热红色(最大成交量),瞬间识别大资金流向。热力图实时更新,一目了然地展示市场密度。
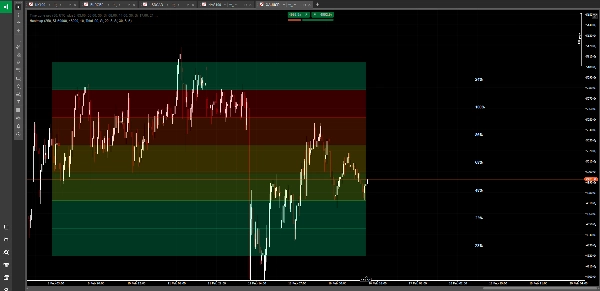
📍 控制点 (POC) 识别
自动识别并突出显示成交量最高的价格水平——市场的真正均衡点。这是机构建仓最多的位置,也是价格倾向回归的区域。
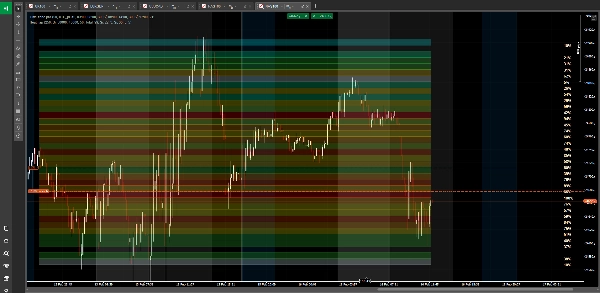
🎯 多级成交量分布
将您的价格区间划分为多达50个精确级别,创建详细的成交量分布图。准确查看哪些价格吸引了大量交易,哪些被市场忽视。
📊 三种成交量分析模式
• 总成交量 - 查看所有市场活动
• 仅买入成交量 - 分离多头压力区
• 仅卖出成交量 - 识别空头分布区域
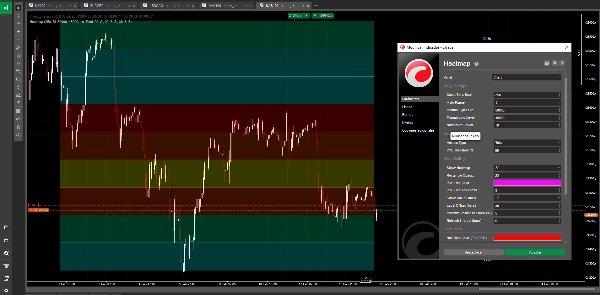
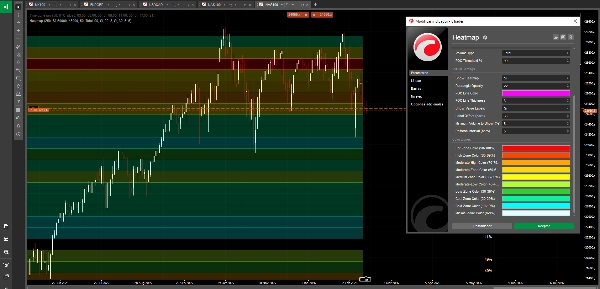
🎨 专业可视化
• 跨越分析周期的色彩编码矩形
• 可调节透明度,实现完美图表融合
• 每个级别可选成交量百分比标签
• 可自定义POC线及其粗细控制
• 干净、不干扰的显示效果
⚙️ 智能自动区间技术
自动根据回溯周期计算最佳价格区间,或手动定义特定分析区间。热力图适应任何市场状况或时间框架。
🔄 性能优化
可配置刷新间隔,确保图表流畅运行,同时保持准确的成交量分析。最多可分析500根K线,无延迟。
📈 可自定义色彩区域
个性化所有10个色彩区域以匹配您的视觉偏好:
• 热区 (90-100%) - 最大成交量集中
• 高区 (80-89%) - 强烈活动
• 中高 (70-79%) - 高于平均成交量
• 中等 (60-69%) - 稳定活动
• 中区 (50-59%) - 平均成交量
• 中低 (40-49%) - 低于平均
• 低区 (30-39%) - 轻度活动
• 凉区 (20-29%) - 最小交易
• 冷区 (10-19%) - 非常轻成交量
• 极少 (0-9%) - 几乎无活动
适用场景:
• 识别机构建仓和分仓区域
• 寻找潜在突破的低成交量节点
• 发现高成交量支撑和阻力位
• 理解市场结构和流动性
• 确认高成交量区域的交易入场
• 避免低流动性陷阱区
• 多时间框架成交量剖面分析
与众不同之处:
传统成交量指标显示交易了多少,但不显示在哪里。Volume Heatmap Pro 展示完整画面——一张视觉密度图,准确显示哪些价格水平吸收了最多交易活动。渐变色系统使复杂的成交量分析如同阅读天气图一样简单。红色表示热(大量成交),蓝色表示冷(少量成交)。
无论您是在进行日内反转剥头皮交易,还是为波段交易布局,这张热力图都能显示市场真正的信念所在,而非噪音。
---
⚠️ 风险提示:
外汇、加密货币及其他金融工具交易风险较高,可能不适合所有投资者。高杠杆可能带来收益,也可能导致亏损。交易前应仔细考虑投资目标、经验水平及风险承受能力。您可能会损失部分或全部投资资金,因此不应投资无法承受损失的资金。应充分了解交易相关风险,如有疑问请咨询独立财务顾问。过往表现不代表未来结果。
摘要
Key features include automatic Point of Control (POC) detection, highlighting the price level with the highest trading volume, and multi-level volume distribution dividing the price range into up to 50 levels for detailed analysis. It supports three volume modes: total volume, buy volume only, and sell volume only, enabling users to isolate bullish or bearish pressure zones.
The indicator offers professional visualization with adjustable opacity, customizable color zones, optional volume percentage labels, and a customizable POC line. Smart auto-range technology calculates optimal price ranges based on the lookback period or manual input. Performance is optimized for smooth updates and analysis of up to 500 bars without lag.
Heatmap is suitable for identifying institutional accumulation and distribution zones, spotting support and resistance levels, understanding market structure, and conducting multi-timeframe volume profile analysis across markets including Forex, indices, and XAUUSD (gold).
客户评价
5 | 67 % | |
4 | 33 % | |
3 | 0 % | |
2 | 0 % | |
1 | 0 % |


