
说明
EMAScalpHistogram:用于交易管理的动量可视化
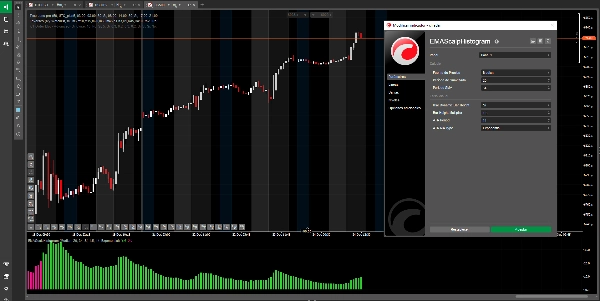
什么是EMAScalpHistogram?
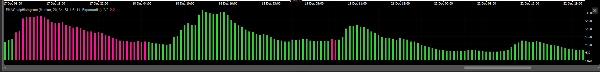
EMAScalpHistogram是一种先进的技术分析工具,将市场动量的复杂性转化为直观且视觉吸引力强的直方图。其设计允许一目了然地识别趋势的强度和方向。
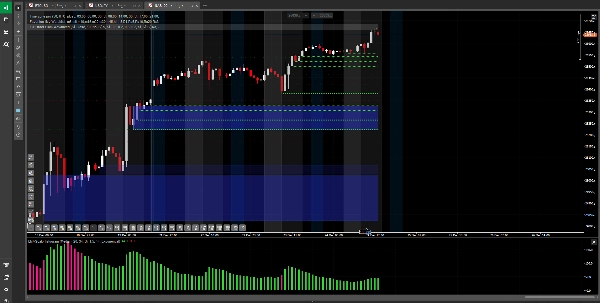
- 绿色柱(看涨): 表示强劲的买入动量,暗示买方控制市场。
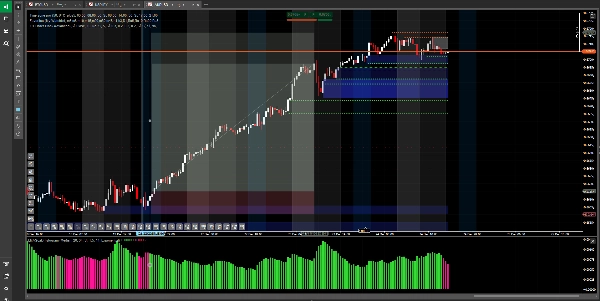
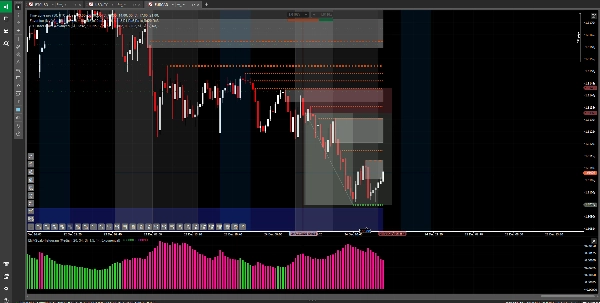
- 粉色柱(看跌): 表示强劲的卖出动量,暗示卖方主导价格走势。
- 动态高度: 柱子的高度不是固定的;它会根据市场波动性调整。较高的柱子表示更强烈且坚定的走势,而较短的柱子则表示暂停或趋势减弱。
主要用途及推荐策略
EMAScalpHistogram是一款精英交易管理工具,专为寻求通过更有信心持仓以最大化利润的交易者设计。它最大的价值在于帮助您维持并放大您的利润,一旦您已经进入交易。
- 趋势确认: 它最强大的功能是验证您已识别趋势的强度。如果您持有多头仓位且直方图持续显示绿色柱子,这就是买入动量依然存在的视觉确认。
- 交易管理(持有并放大利润):
-
- 持有仓位: 这是其最有价值的应用。用它来决定何时有信心持有仓位。如果直方图继续显示对您有利的柱子,它能让您有纪律性,不因市场小幅波动而过早平仓获利交易。
- 放大利润: 通过帮助您在整个强劲动量阶段持有仓位,它使您能够捕捉更大的波动并放大利润潜力。
- 动量减弱警报: 直方图颜色的变化(从绿色变为粉色或反之)是动量消退的首个警示之一,提示可能是锁定利润或调整退出策略的好时机。
应避免的事项
非入场信号: 关键是,EMAScalpHistogram并非设计为单独用作开仓新交易的信号。作为确认已进行走势强度的指标,用它作为入场信号可能导致交易延迟,风险高且利润潜力有限。
风险警告及免责声明
使用此指标风险自负。交易金融工具风险极高,可能不适合所有投资者。此工具不构成投资建议或财务建议。过去的表现不保证未来结果。强烈建议在真实资金投入前先在模拟账户测试任何策略。
摘要
指标配置
客户评价
4.6
评价:3
5 | 67 % | |
4 | 33 % | |
3 | 0 % | |
2 | 0 % | |
1 | 0 % |
客户评价
January 6, 2026
The entry stops feeling automatic, but the trade still needs a calm entry.
December 31, 2025
讨论
常见问答
Forex
Indices
Commodities
Crypto
Stocks
cTrader Store 提供的所有产品,包括交易机器人、指标和插件,均由第三方开发者提供,仅供信息参考和技术访问之用。cTrader Store 并非经纪商,不提供投资建议、个人推荐或任何未来业绩保证。


价格
注册日期 24/02/2025
15
销售
1.82K
免费安装