
说明
SMARTRSI 云系统 - 高级动量分析工具
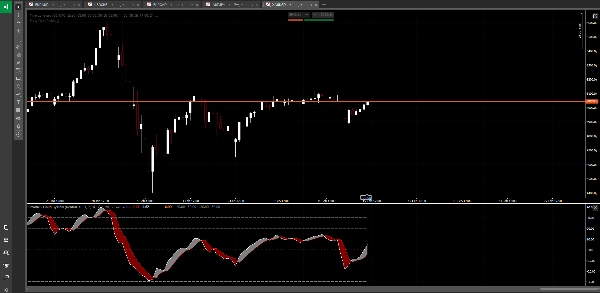
通过这款革命性指标,结合了Heikin Ashi平滑技术和零中心RSI,彻底改变您的RSI分析,带来清晰的动量信号。与传统RSI指标可能嘈杂且难以解读不同,SmartRSI云系统过滤市场噪音,突出真实的方向性动量。
主要特点:
☁️ Heikin Ashi RSI 云
体验平滑的动量分析和可视化云层形态。云层即时显示市场动量的强度和方向,使趋势识别轻松无忧。
⚖️ 零中心RSI
准确观察动量——以零为中心,清晰显示多头/空头偏向。正值表示买方力量,负值显示卖方压力。不再猜测RSI是上升还是下降趋势。
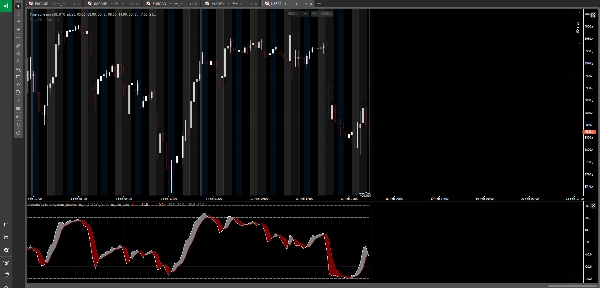
🎯 智能平滑技术
通过智能RSI平滑消除假信号。该指标将Heikin Ashi原理应用于RSI计算,大幅减少震荡,同时保持信号准确性。
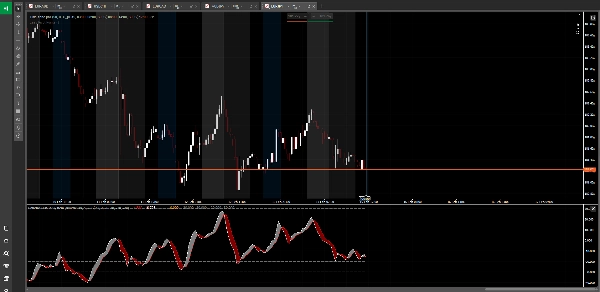
🔄 自适应交易者模式
在三种交易模式间切换:
• 中立模式 - 查看所有信号
• 买方模式 - 仅筛选多头机会
• 卖方模式 - 仅筛选空头机会
📊 多级超买/超卖区
四个不同级别帮助您判断动量极端:
• 标准超买/超卖水平用于初步警告
• 极端超买/超卖水平用于反转区
• 完全可自定义以匹配您的交易风格
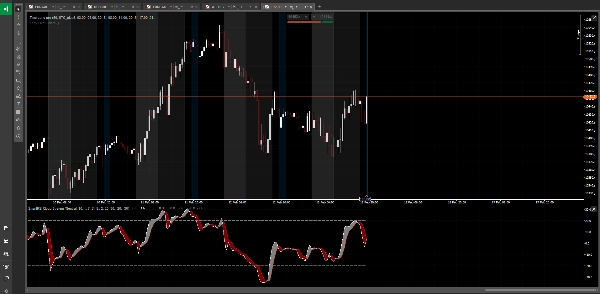
🎨 专业可视化
干净、直观的显示,包含:
• 颜色编码的云层形态
• 可选的RSI绘图线,颜色可自定义
• 清晰的边界水平
• 零线参考,瞬间识别偏向
⚙️ 完全可定制
调整各个方面:
• HARSI长度和平滑参数
• RSI计算周期
• 超买/超卖水平
• 视觉元素和颜色
• 交易者模式偏好
适用场景:
• 识别强劲的动量趋势
• 发现价格与动量之间的背离
• 把握超买/超卖条件下的入场时机
• 根据市场偏向筛选交易
• 确认突破和趋势延续
• 多时间框架动量分析
与众不同之处:
传统RSI指标显示的是原始动量数据,可能波动剧烈且误导。SmartRSI云系统应用机构级平滑技术,同时保持信号完整性。零中心方法消除了对动量方向的困惑,云层可视化使复杂的动量模式瞬间可辨。
无论您是做剥头皮、日内交易还是波段交易,该工具都能为您提供标准指标无法比拟的市场动量清晰度。
---
⚠️ 风险声明:
交易外汇、加密货币及其他金融工具具有高风险,可能不适合所有投资者。高杠杆可能对您不利,也可能有利。在决定交易前,您应仔细考虑投资目标、经验水平和风险承受能力。您可能会损失部分或全部投资资金。因此,不应投资您无法承受损失的资金。您应了解所有交易相关风险,如有疑问,请咨询独立财务顾问。过往表现不代表未来结果。
摘要
客户评价
5 | 100 % | |
4 | 0 % | |
3 | 0 % | |
2 | 0 % | |
1 | 0 % |


