
说明
SC ADX Dots
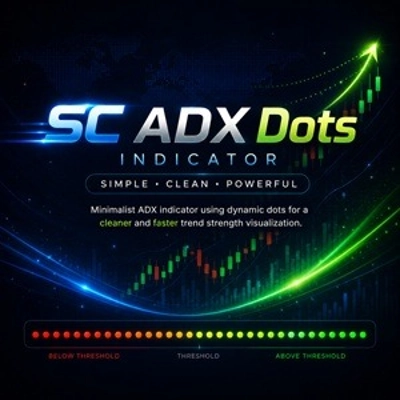
SC ADX Dots 是经典ADX指标的极简版本,旨在提供更清晰、更直观的趋势强度视图,而不会用不必要的线条使图表显得杂乱。
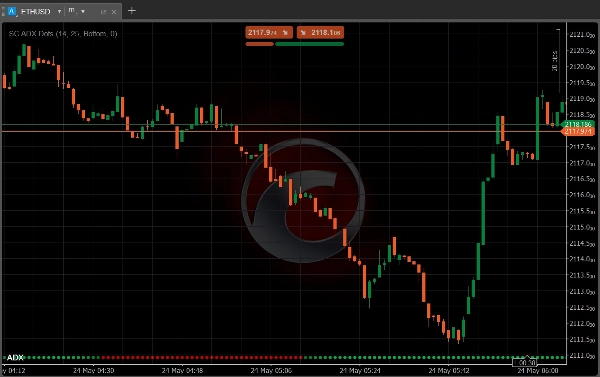
该指标不是显示传统的ADX线,而是使用动态点来表示ADX值随时间的变化。
这种方法创造了一个更简洁、更现代的图表布局,更易于阅读,尤其适合同时使用多种工具的交易者。
主要特点
- 使用点而非线条显示ADX
- 更简洁且不分散注意力的图表外观
- 两种不同的颜色模式:
-
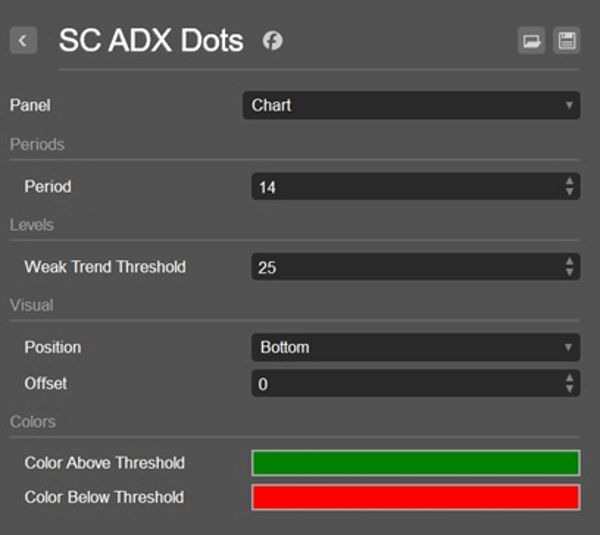
- ADX低于阈值时的一种颜色
- ADX高于阈值时的另一种颜色
- 颜色强度根据ADX强度动态变化
- 快速直观地读取趋势动量
- 适合剥头皮、日内交易和自由裁量交易
为何使用SC ADX Dots
传统ADX指标可能使图表显得拥挤且难以阅读,尤其是在与其他指标或价格行为工具结合使用时。
SC ADX Dots的创建目标只有一个:
保持图表视觉上的简洁,同时提供关于趋势强度的所有关键信息。
自适应点的可视化让交易者能够立即识别市场动量是增加还是减少,而不会被屏幕上的额外线条分散注意力。
适用人群
- 偏好简洁图表的交易者
- 价格行为交易者
- 剥头皮交易者和日内交易者
- 多指标交易组合
- 快速市场分析
重要提示
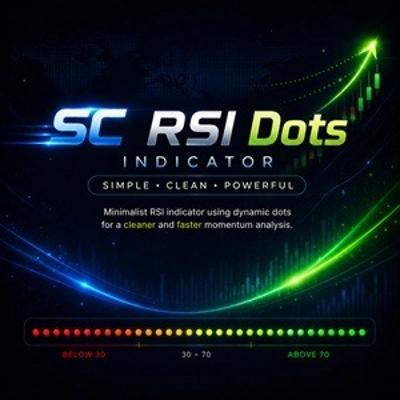
SC RSI Dots设计为直接用于主价格图表。
与传统RSI指标不同,其视觉概念围绕将动量信息整合到价格行为分析中构建。因此,不建议在单独面板中使用该指标,这样做无法提供预期的用户体验。
简单。清晰。有效。
摘要
AI 摘要
SC ADX Dots is a minimalist adaptation of the classic Average Directional Index (ADX) indicator designed to visualize trend strength using dynamic dots instead of traditional lines. This approach reduces chart clutter, providing a cleaner and more intuitive view of market momentum. The indicator displays ADX values as dots whose color changes based on whether the ADX is above or below a set threshold, with color intensity dynamically reflecting the strength of the trend. This visualization enables quick assessment of trend momentum, making it suitable for scalping, intraday, and discretionary trading. SC ADX Dots integrates directly on the main price chart, supporting traders who prefer clean layouts and multi-indicator setups. It is particularly useful for price action traders seeking fast market analysis without distraction from excessive chart elements. The indicator supports visualization and filtering outputs and is based on bar data. It provides signals related to trend strength and breakout detection.
指标配置
指标分类
动量
输出类型
可视化
过滤器
数据要求
仅 K 线
支持的信号
趋势强度
突破
讨论
客户评价
5.0
评价:1
5 | 100 % | |
4 | 0 % | |
3 | 0 % | |
2 | 0 % | |
1 | 0 % |
客户评价
July 19, 2026
SC ADX Dots is a brilliant minimalist take on the classic ADX indicator. By replacing cluttered lines with dynamic dots plotted directly on the price chart, it seamlessly integrates trend-strength data into your price action analysis. The color threshold and intensity features provide instant visual feedback on market momentum. While it lacks alerts and directional bias, it’s a lightweight, highly effective tool for scalpers and price action traders who value clean charts.
常见问答
ADX
cTrader Store 提供的所有产品,包括交易机器人、指标和插件,均由第三方开发者提供,仅供信息参考和技术访问之用。cTrader Store 并非经纪商,不提供投资建议、个人推荐或任何未来业绩保证。
















价格
注册日期 04/01/2026
496
免费安装