说明
🚀 机构级 Nonlag Candle - 专业交易指标
用机构级移动平均技术改变您的交易方式
机构级 Nonlag Candle 是为追求精确、准确和机构级市场分析的严肃交易者设计的最先进移动平均系统。
💎 为什么这个指标改变一切
不同于传统的滞后价格动作的移动平均线,该指标使用 先进的数学算法 消除延迟同时保持准确性。这是机构交易者用来领先市场走势的同样技术。
✨ 使其与众不同的关键特性:
🎯 零滞后技术
- 实时响应价格变动,无标准移动平均线的典型滞后
- 比任何EMA、SMA或WMA更早捕捉趋势变化
- 非常适合剥头皮、日内交易和波段交易
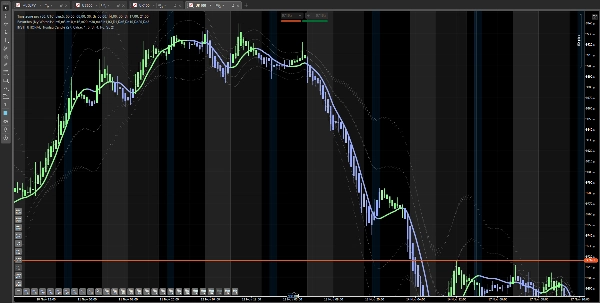
📊 机构偏差带
- 自动显示1、2或3个标准偏差带
- 以精准的方式识别超买/超卖状态
- 准确显示价格何时移动过快过远
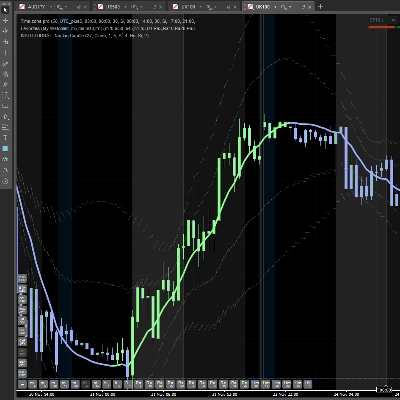
🎨 视觉清晰系统
- 颜色编码的蜡烛和线条(绿色=看涨,红色=看跌,灰色=中性)
- 即时视觉确认趋势方向
- 无需猜测——市场告诉你它在做什么
⚡ 成交量加权智能(可选)
- 结合成交量数据以获得更准确的读数
- 区分弱势走势和强机构活动
- 对高成交量价格动作赋予更大权重
🎯 专业交易者如何使用此指标
策略1:高概率入场
设置: 市场处于看涨趋势,但价格触及第2或第3上轨带。
你的行动: 不要追涨!价格已过度延伸。等待回调。
入场: 当价格回撤至Nonlag Candle线且蜡烛颜色保持绿色(未变红),这就是信号——回调可买,趋势依然有效。
为什么有效: 你在确认的上升趋势中以折扣价买入。更好的入场=更紧的止损=更好的风险/回报。
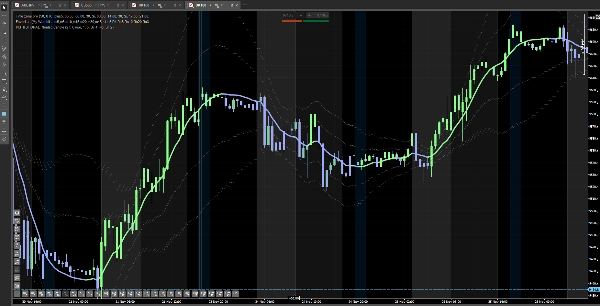
策略2:趋势反转检测
设置: 价格处于下跌趋势,反复触及下轨带。
信号: 价格从第2或第3下轨带反弹,且Nonlag Candle由红转绿。
你的行动: 立即做多。市场结构刚从看跌转为看涨。
为什么有效: 你在反转初期介入,而不是在价格已经移动100+点之后。
策略3:像专业人士一样获利了结
看涨交易:
- 入场:在上升趋势中接近Nonlag Candle线
- 部分获利:价格触及第1上轨带(快速剥头皮)
- 全部获利:价格触及第2或第3上轨带(最大延伸)
为什么有效: 这些带显示统计学上的极端价格水平。当价格达到第3轨带时,回调概率大增——机构交易者在那里获利,你也应该如此。
🔥 与普通移动平均线的区别
标准移动平均线 滞后时间长(落后3-10+根K线),无超买/超卖区,仅显示基本线条,不整合成交量,入场时机晚,且产生许多假信号。
机构级 Nonlag Candle 几乎零滞后,实时响应,包含3级偏差带,颜色编码蜡烛及线条,可选成交量整合,最佳入场时机,信号由偏差带过滤。
区别显而易见:传统移动平均线让你追赶市场,而此指标让你领先市场。
💰 真实交易场景
场景1:完美回调 你看到UK100强劲上涨。价格冲到第3上轨带。你没有恐慌买入,而是等待。价格回撤到绿色Nonlag Candle线。线保持绿色。 入场。结果:你比追涨的人便宜买入了80点。
场景2:避免陷阱 EUR/USD下跌。从第2下轨带反弹。大多数交易者会在这里买入,但Nonlag Candle仍为红色。你选择观望。价格再跌50点。 你刚刚保住了账户。
场景3:剥头皮者的梦想 你在做5分钟图剥头皮。Nonlag Candle变绿。你入场。15分钟内价格触及第1上轨带。你获利了结20点。每个交易时段重复4-5次。 每天80-100点,风险极小。
🎓 谁应该使用此指标?
✅ 日内交易者 - 快速进出场,信号精准
✅ 剥头皮交易者 - 偏差带提供完美获利目标
✅ 波段交易者 - 早期识别主要趋势变化
✅ 初学者 - 颜色编码系统简化决策
✅ 专业人士 - 机构级工具,适合严肃交易
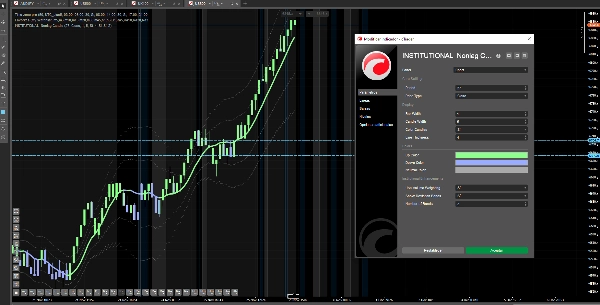
⚙️ 完全可定制
- 周期调整 - 优化任何时间框架(1分钟到日线)
- 价格类型选择 - 收盘价、典型价、加权价或自定义
- 带级别 - 选择1、2或3个偏差带
- 配色方案 - 匹配你的图表美学
- 成交量加权 - 根据策略开启/关闭
🛡️ 内置风险管理
偏差带不仅用于入场——它们是你的 风险管理系统:
- 止损: 设置在Nonlag Candle线下方(或第1带下方以获得更紧止损)
- 仓位大小: 在第2/3带入场时减小仓位(延伸走势)
- 获利目标: 通过偏差带自动显示——无需猜测
🚀 今天开始更聪明地交易
这不仅仅是另一个移动平均线。它是一个 完整的交易系统,告诉你:
✅ 何时入场(颜色变化+带位置)
✅ 何时等待(价格处于极端带)
✅ 何时退出(达到相反带)
✅ 何时观望(信号冲突)
停止使用过时指标交易。开始用机构智能交易。
📈 适用于所有市场
- 外汇(EUR/USD,GBP/USD,USD/JPY等)
- 指数(US30,UK100,NAS100,GER40)
- 商品(金,油,银)
- 加密货币(BTC,ETH)
- 所有时间框架(1分钟到月线)
🎁 限时优惠
立即获取 机构级 Nonlag Candle,将你的交易从被动转为主动。
自信交易,精准交易,使用机构工具交易。
此指标兼容cTrader平台。一次购买,终身更新。
摘要
客户评价
5 | 50 % | |
4 | 50 % | |
3 | 0 % | |
2 | 0 % | |
1 | 0 % |


