Descrição
Imagine ter um analista profissional sentado bem ao seu lado, observando constantemente suas telas de negociação e marcando todas as zonas mais críticas para você em tempo real. É exatamente isso que nosso indicador avançado multi-temporal do cTrader foi projetado para fazer. Construído especificamente para traders que seguem a metodologia Inner Circle Trader, ou ICT, esta ferramenta elimina o trabalho pesado da análise técnica. Ela escaneia automaticamente o mercado para identificar conceitos fundamentais de smart money, traduzindo a ação de preço complexa em um mapa visual claro e fácil de ler. Em vez de passar horas desenhando linhas e caixas manualmente, você pode se concentrar totalmente em planejar suas negociações e gerenciar seu risco.
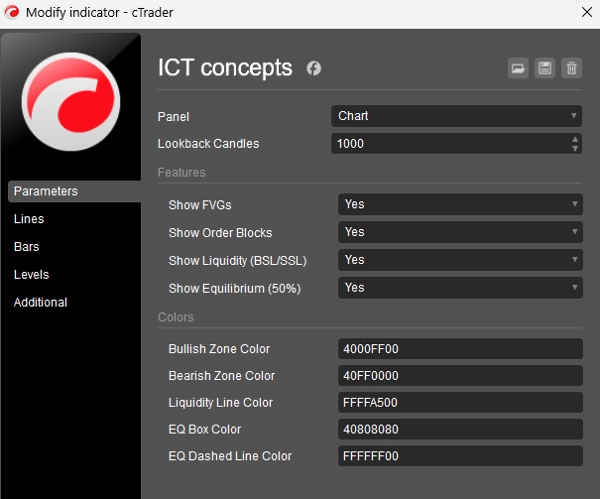
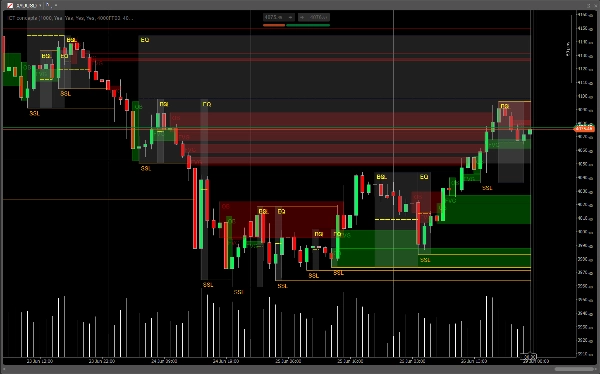
O indicador identifica facilmente os pilares centrais da estratégia ICT e os apresenta de uma forma incrivelmente fácil de entender. Ele localiza Fair Value Gaps, que são áreas onde o preço se moveu rápido demais e deixou um espaço vazio que o mercado geralmente quer revisitar e preencher. Também detecta Order Blocks, destacando as áreas específicas onde grandes instituições financeiras provavelmente colocaram suas negociações massivas antes de um grande movimento de mercado. Além disso, sinaliza automaticamente os pools de liquidez do lado de compra e venda. Essas são essencialmente áreas onde muitos traders comuns colocaram suas ordens de stop-loss, que atuam como um ímã para o mercado. Finalmente, calcula os intervalos de negociação de Equilíbrio, dividindo o mercado de forma organizada em metades de prêmio e desconto para que você sempre saiba se está comprando a um preço barato ou vendendo a um preço caro.
Uma das maiores frustrações com a maioria das ferramentas de negociação automatizadas é que elas rapidamente transformam seu gráfico em uma teia confusa e bagunçada de linhas antigas e inúteis. Resolvemos isso desenvolvendo um motor de mitigação inteligente embutido. No exato momento em que o preço toca um order block, preenche completamente um gap ou varre um pool de liquidez, o indicador sabe que a zona foi "utilizada". Ele para instantaneamente de desenhar essa forma específica para frente no tempo, garantindo que sua tela permaneça perfeitamente limpa. Você verá apenas as zonas novas e intactas que realmente importam para a ação atual do mercado.
Para lhe dar a vantagem definitiva, esta ferramenta usa um poderoso sistema de projeção multi-temporal. Grandes movimentos de mercado são ditados por timeframes superiores, mas as entradas de negociação mais seguras e precisas acontecem nos inferiores. Este indicador se ancora nativamente no gráfico de quinze minutos altamente confiável para reunir todos os seus dados estruturais. Então, sem que você precise clicar para frente e para trás entre diferentes telas, ele projeta essas importantes zonas de quinze minutos perfeitamente em seus gráficos muito mais rápidos de um minuto, três minutos e cinco minutos. Isso permite que você acerte suas entradas com incrível precisão nos gráficos rápidos enquanto fica tranquilo sabendo que está completamente alinhado com a tendência institucional maior e de alta probabilidade.















![Logótipo de "[Stellar Strategies] Market Session Ultimate"](https://cdn.ctrader.com/image/webp/61ffd537-0125-4246-9e72-42eca1791d64_28232)