

说明
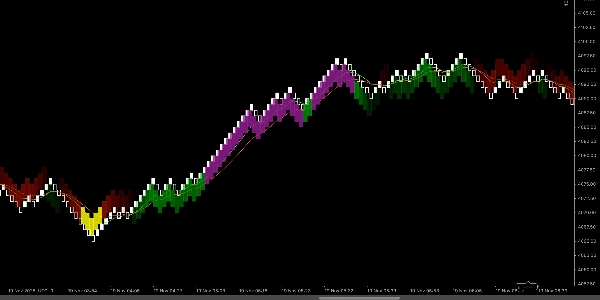
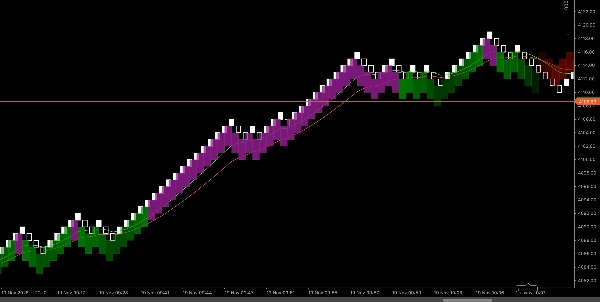
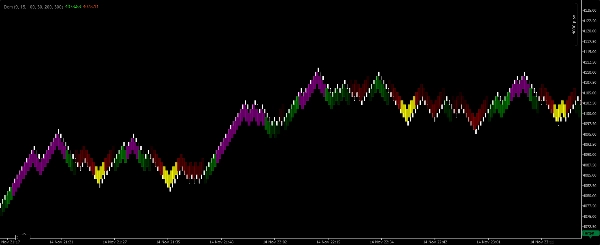
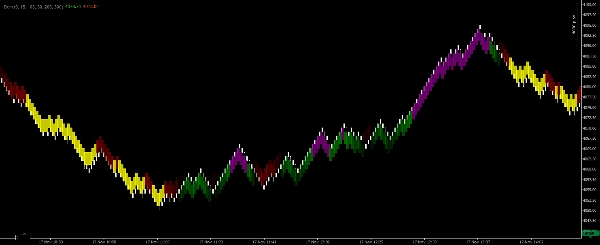
Renko EMA-Scalper 区域 是一个轻量级的视觉剥头皮指标,专为 cTrader 平台上的 Renko 100 点图表 构建。它使用两个指数移动平均线(EMA)来识别短期趋势方向,并突出显示清晰的可交易区域。该指标在图表上绘制四种颜色的填充矩形,使剥头皮交易者能够立即读取市场偏向,并在无需手动计算的情况下发现更高概率的入场点。
每种颜色的含义
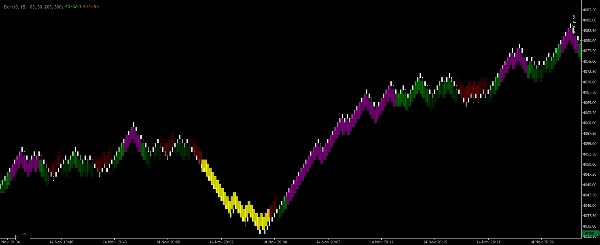
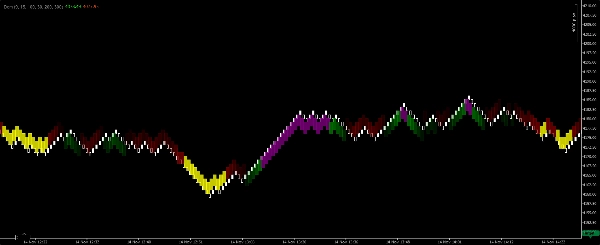
- 绿色矩形 — 确认看涨趋势。快速 EMA 位于慢速 EMA 之上,且 EMA 方向向上。用于短线顺势做多。
- 紫色矩形 — 看涨背景下的买入入场区。表示在活跃的看涨趋势中出现短期回调或盘整,可能提供剥头皮入场机会。
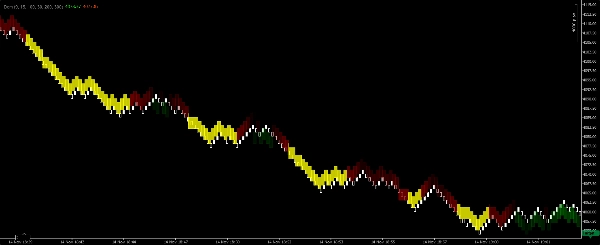
- 红色矩形 — 确认看跌趋势。快速 EMA 位于慢速 EMA 之下,且 EMA 方向向下。用于短线顺势做空。
- 黄色矩形 — 看跌背景下的卖出入场区。表示在活跃的看跌趋势中出现短期回调或盘整,可能提供剥头皮入场机会。
工作原理(逻辑摘要)
- 该指标在 Renko 100 点图表上计算两个 EMA(快速和慢速),并评估它们的相对排列和斜率以确定趋势方向。
- 当 EMA 显示出明确的看涨排列和动量时,指标绘制一个绿色矩形,覆盖趋势区域。如果在该看涨区域内出现短期盘整或回调,指标会绘制一个紫色矩形,标记买入入场机会。
- 相同逻辑反向应用于看跌条件,生成红色(趋势)和黄色(入场)矩形。
- 矩形作为区域绘制(而非单根柱),以便剥头皮交易者能直观评估何时快速入场和退出。
推荐设置(剥头皮默认值)
- 图表类型: Renko
- Renko 砖块大小: 100 点(指标为此砖块大小设计)。
- 灵敏度 / 检测 — 可调参数控制指标在绘制趋势矩形前对 EMA 排列的严格程度(值越低信号越多;值越高信号越少但更强)。
- 矩形透明度 — 调整以确保价格柱上的视觉清晰度。
- 交易时段过滤器 — 建议限制在高流动性时段进行剥头皮交易。
- 最大区域宽度(柱数) — 可选限制,避免区域过度拉伸。
使用指导及剥头皮规则
- 将绿色/红色矩形视为趋势确认。优先顺势交易彩色趋势区域方向,避免在趋势矩形主导时进行激进的逆势剥头皮。
- 将紫色/黄色矩形视为剥头皮入场窗口,位于确认趋势内 — 入场前寻找快速微观结构触发信号(例如动量柱、小盘整突破)。
- 目标应紧凑且现实,适合剥头皮(止损的倍数较小)。根据风险偏好使用固定点数目标或最小柱确认。
- 止损应置于近期微观结构低点/高点之外或入场区外;剥头皮需纪律性强,损失小。
- 结合成交量/价格行为确认(如有),仅在活跃交易时段内交易。
- 在您的交易工具上进行视觉回测 — Renko 100 点适合波动性较大的货币对和能产生有用价格结构的工具,便于剥头皮。
摘要
指标配置
客户评价
4.2
评价:4
5 | 50 % | |
4 | 25 % | |
3 | 25 % | |
2 | 0 % | |
1 | 0 % |
客户评价
November 25, 2025
A decent setup here should survive 50 quick trades without looking messy. A few sessions of data make the result easier to trust. The useful comparison is hit rate versus average R.
November 18, 2025
The product feels more useful when the plan is already written down. A 13 setup run on daily close keeps the review grounded.
November 18, 2025
This feels useful when you already has a plan. The main value is short term execution, not chasing every signal that appears. Early sizing should stay modest until the journal looks stable.
November 18, 2025
Useful tool, but not for lazy entries. It supports short term execution and feels more useful if the trader stays selective.
讨论
常见问答
BTCUSD
Forex
Signal
Scalping
Commodities
Crypto
XAUUSD
cTrader Store 提供的所有产品,包括交易机器人、指标和插件,均由第三方开发者提供,仅供信息参考和技术访问之用。cTrader Store 并非经纪商,不提供投资建议、个人推荐或任何未来业绩保证。
该作者的其他作品


猜您喜欢


价格
注册日期 14/03/2025
23
销售