
说明
TECHNICAL ANALYSIS 指标是为 cAlgo 平台开发的高级技术分析解决方案,集成了多个技术指标,专注于识别强劲趋势、市场动量和成交量确认。它结合了 ADX(平均方向指数)与斜率分析、成交量过滤和实时多指标技术分析,为交易者提供全面且可靠的决策视角。
🔍 主要策略
1. 基础:ADX + DI(方向移动系统)
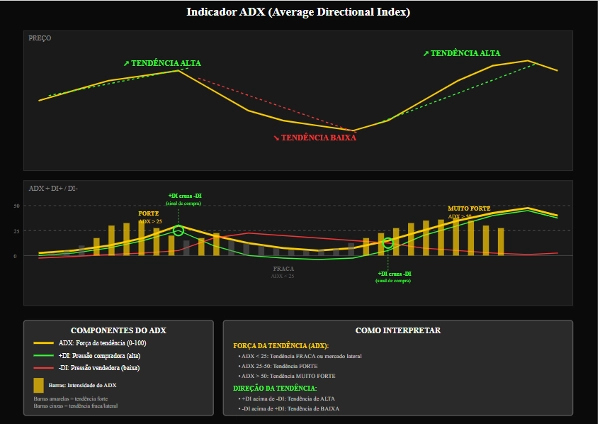
指标的核心是 ADX(平均方向指数),用于衡量趋势的强度。
+DI(正方向指标)和 -DI(负方向指标)组件用于识别趋势方向:
+DI > -DI → 上升趋势
-DI > +DI → 下降趋势
2. 斜率动态动量分析
通过线性回归计算 ADX、+DI 和 -DI 的斜率。
这有助于识别趋势是否:
增强(正斜率)
减弱(负斜率)
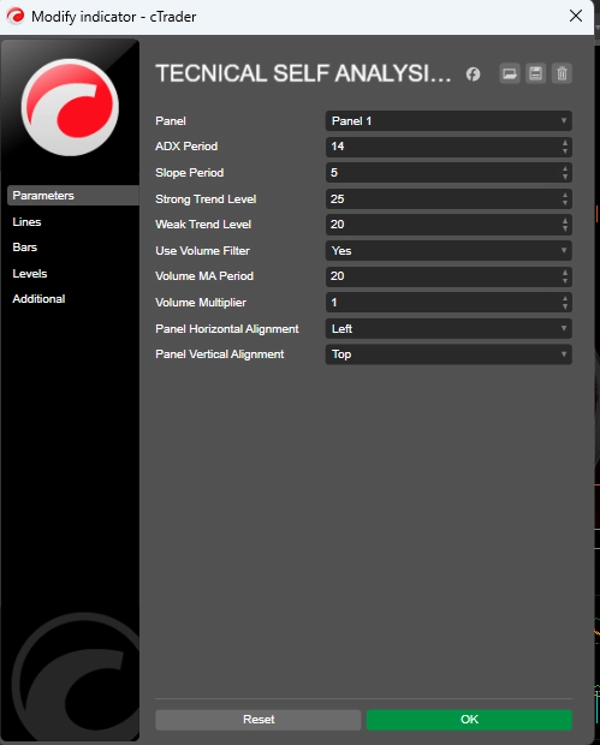
3. 参考水平
强趋势水平:趋势被认为强劲的水平以上(默认值:25)
弱趋势水平:考虑有效趋势的最低水平(默认值:20)
低于弱趋势水平的趋势被视为横盘或无明确方向。
📈 信号生成
买入条件
✅ +DI 上穿 -DI
✅ ADX 高于弱趋势水平(Weak Trend Level)
✅ ADX 和 +DI 斜率为正
✅ 成交量确认(可选)
卖出条件
✅ -DI 上穿 +DI
✅ ADX 高于弱趋势水平(Weak Trend Level)
✅ ADX 和 -DI 斜率为正
✅ 成交量确认(可选)
强信号:当 ADX 高于强趋势水平且斜率显著为正时,指标生成强化信号,避免连续重复入场。📊 成交量过滤器(可选)
指标可能需要成交量确认后才生成信号。
当前成交量必须大于或等于成交量移动平均 × 乘数。
这有助于过滤流动性不足市场中的虚假突破和信号。
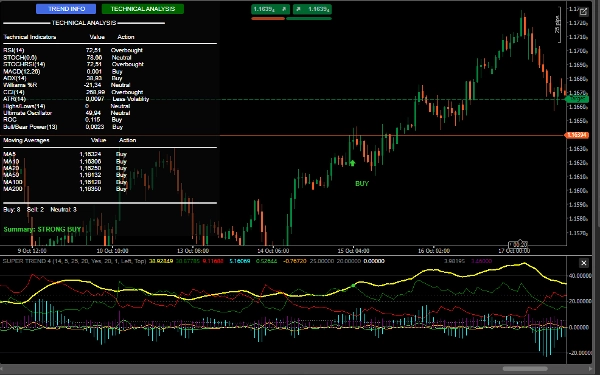
🧠 高级技术分析(交互面板)
TECHNICAL ANALYSIS 包含图表上的两个交互面板:
1. 趋势信息
趋势类型:上升趋势 / 下降趋势 / 横盘
趋势强度:强 / 弱
动量:增强 / 减弱 / 稳定
当前 ADX、+DI、-DI 和斜率值
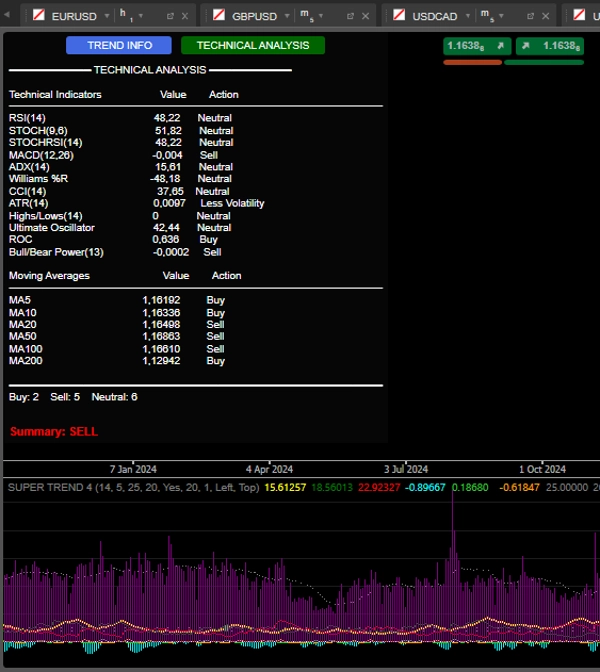
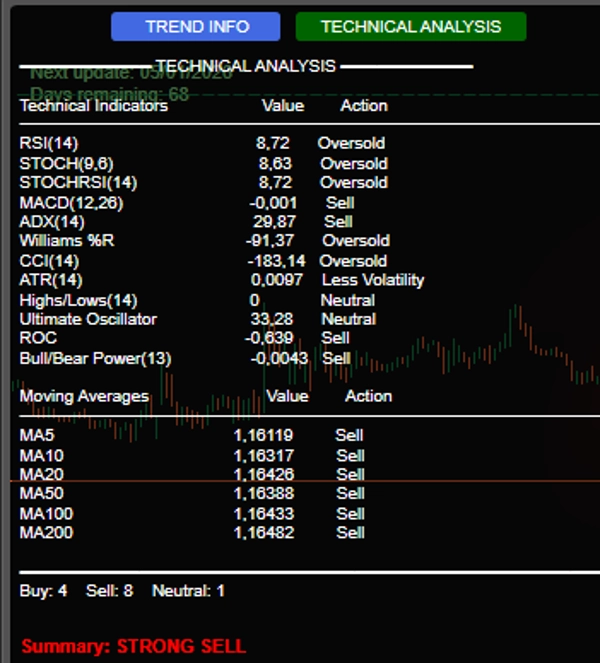
2. 技术分析
执行实时多指标分析,包括:
RSI(14) – 超买/超卖
随机指标(14) – 动量
MACD(12,26) – 交叉和背离
Williams %R – 市场极端
CCI(14) – 与典型价格的偏离
ROC(12) – 变化率
终极振荡器 – 强度确认
多空力量 – 买卖压力
移动平均线 (5,10,20,50,100,200) – 长期趋势
最终总结:系统统计买入/卖出/中性信号,并给出明确建议:
强烈买入(≥7 个买入信号)
买入
卖出
强烈卖出(≥7 个卖出信号)
中性
🔔 警报和可视化
图表上的视觉信号:
带有“BUY”/“SELL”标签的绿/红箭头
声音通知(Windows)
控制台中的详细日志,包括:
信号时间
ADX、DI 和成交量值(如果启用)
🛡️ 竞争优势
✅ 多指标集成于单一面板
✅ 关注趋势强度和方向(不仅仅是价格)
✅ 成交量过滤以提高可靠性
✅ 交互式且信息丰富的界面
✅ 清晰信号,配有视觉和声音警报
这是测试版本。


