
Swing Levels
指标
1.1K 下载
版本 1.0, Apr 2025
Windows 版、Mac 版
4.0
评价:2
说明
Pinescritlabs Ctrader 商店 指标 :
🔍 摆动水平
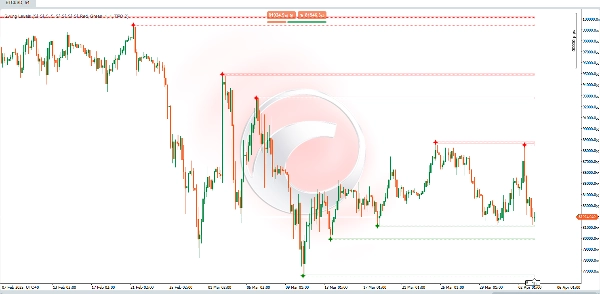
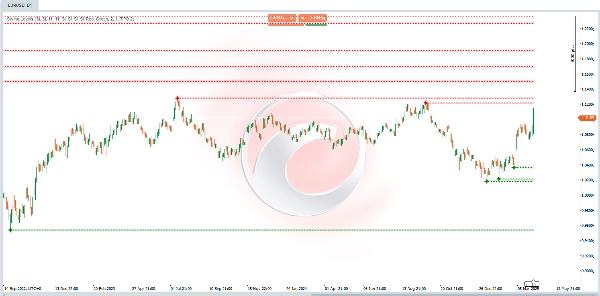
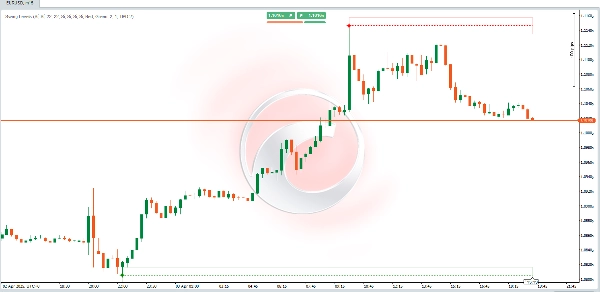
此指标旨在 自动检测 基于图表中的“摆动”或枢轴点(即显著的高点和低点)的支撑和阻力水平。一旦识别出这些点,它会绘制 线条或区域(矩形),作为价格行为和交易决策的关键参考。
🛠 主要特点:
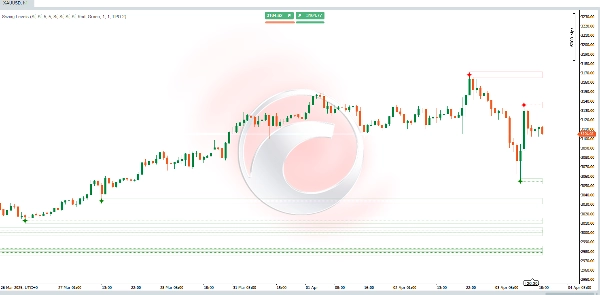
✅ 关键水平识别: 它突出显示最新的 摆动高点 和 摆动低点 的形成位置。这些水平通常在未来充当支撑或阻力。
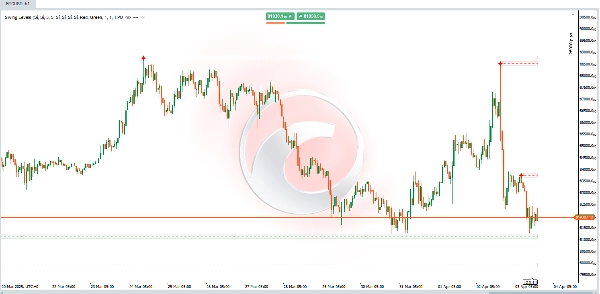
✅ 市场结构分析: 帮助可视化市场是否形成 更高的高点和更高的低点(看涨) 或 更低的高点和更低的低点(看跌)——这是识别趋势和潜在反转点的关键。
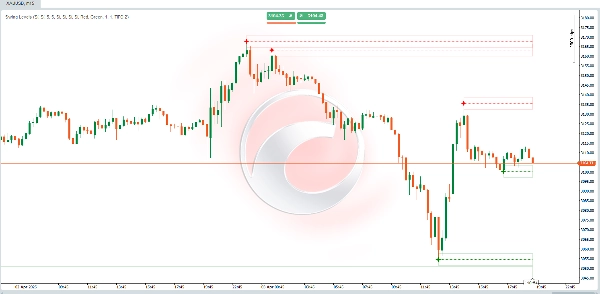
✅ 决策工具: 交易者可以利用这些水平来确定 入场点、止损位置或获利区间,利用动态支撑和阻力。
🧠 它是如何工作的?
1️⃣ 枢轴检测(摆动高点和摆动低点)
📌 指标分析定义数量的蜡烛/柱,向 左侧和右侧(参数: “左柱” & “右柱”)。
📌 为检测 摆动高点,它检查中央柱(潜在枢轴)的高点是否 高于范围内相邻柱的高点。
📌 为检测 摆动低点,它应用相同逻辑,但比较的是 低点。
📊 解读绘制的水平:
🔴 摆动高点 → 潜在阻力区:
- 如果价格回到该水平,注意拒绝(卖出)或 突破(看涨延续)。
🟢 摆动低点 → 潜在支撑区:
- 如果价格再次触及该水平,观察反弹(买入)或 跌破(看跌延续)。
摘要
AI 摘要
Swing Levels is a technical indicator that automatically identifies key support and resistance levels on trading charts by detecting "swings" or pivot points—significant highs and lows. It analyzes a specified number of bars to the left and right of each candle to determine swing highs and lows, then draws lines or rectangular zones representing these levels. These levels serve as important references for price action analysis and trading decisions.
Key features include:
- Identification of recent swing highs and lows, which often act as future support or resistance.
- Visualization of market structure by highlighting patterns of higher highs and lows (bullish) or lower highs and lows (bearish), aiding trend recognition and reversal detection.
- A decision-making tool for traders to set entry points, stop-losses, and take-profit zones based on dynamic support and resistance.
Swing highs indicate potential resistance zones where price may reject or break out, while swing lows indicate potential support zones where price may bounce or break down. This indicator supports analysis across various markets and timeframes by providing clear visual cues of market turning points.
指标配置
客户评价
4.0
评价:2
5 | 0 % | |
4 | 100 % | |
3 | 0 % | |
2 | 0 % | |
1 | 0 % |
客户评价
August 12, 2025
Pros: Automatically identifies swing highs/lows and plots levels as lines, boxes or labels. Includes volume filtering and liquidity context. Works across multiple timeframes. Cons: No tooltips, alerts, or template-saving. Can clutter chart if many swing levels are active. Slight lag on lower-end P
讨论
常见问答
Breakout
Supertrend
RSI
cTrader Store 提供的所有产品,包括交易机器人、指标和插件,均由第三方开发者提供,仅供信息参考和技术访问之用。cTrader Store 并非经纪商,不提供投资建议、个人推荐或任何未来业绩保证。


价格
注册日期 03/10/2024
163
销售
37.94K
免费安装