
PDHL
Indikator
1.85K unduhan
Versi 1.0, Sep 2024
Windows, Mac
2.5
Ulasan: 2
Deskripsi
Memperkenalkan Indikator Perdagangan High-Low
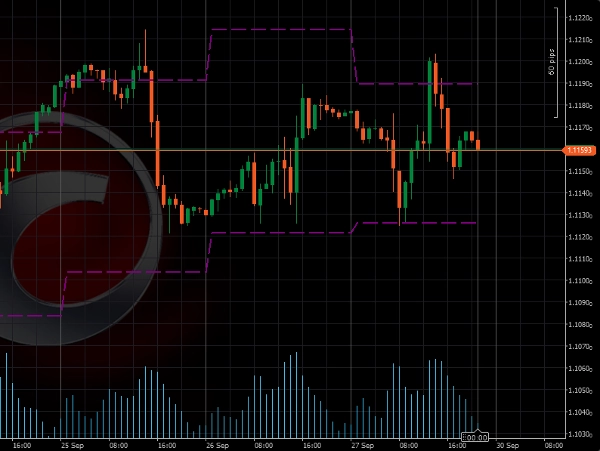
Indikator ini dirancang untuk secara otomatis menggambar level harga tertinggi dan terendah hari sebelumnya pada grafik Anda. Alat ini membantu Anda dengan cepat mengidentifikasi level kunci untuk potensi breakout dan pembalikan.
Manfaat Utama:
- Ideal untuk Perdagangan Breakout: Indikator ini menyoroti level harga penting dari hari sebelumnya, yang sering digunakan sebagai titik referensi untuk strategi breakout. Perdagangan breakout di atas atau di bawah level ini dapat menawarkan setup dengan potensi tinggi.
- Sederhana Namun Efektif: Indikator Perdagangan High-Low fokus pada salah satu aspek terpenting dari aksi harga – harga tertinggi dan terendah hari sebelumnya. Dengan memasukkan level ini ke dalam strategi Anda, Anda mendapatkan pemahaman yang lebih jelas tentang struktur pasar dan potensi titik balik.
Perhatian:
- Sebaiknya digunakan pada kerangka waktu kurang dari 1 Hari
Pengaturan:
- Sertakan Hari Minggu: default = no
Ringkasan
Ringkasan AI
The PDHL (Previous Day High & Low) indicator automatically plots the prior day's highest and lowest price levels on trading charts. It is designed to assist traders in identifying key price levels that may signal potential breakouts or reversals. By highlighting these critical levels, the indicator supports breakout trading strategies, providing reference points for entering trades when price moves above or below the previous day's range. The tool emphasizes simplicity and effectiveness by focusing on essential price action elements, helping traders better understand market structure and potential turning points. It is best used on intraday timeframes shorter than one day. A configurable setting allows users to include or exclude Sunday in the calculation, with the default setting excluding it.
Profil indikator
Ulasan pelanggan
2.5
Ulasan: 2
5 | 0 % | |
4 | 0 % | |
3 | 50 % | |
2 | 50 % | |
1 | 0 % |
Ulasan pelanggan
October 9, 2025
What Timezone is it in at default? It seems to fail to get the accurate Highs and lOws for different istruments. You could add that as a customisable input. Please add closing price too
July 9, 2025
Pros: Simple and clear display of previous day's high/low levels. Stable performance. Easy to use and customize. Cons: No breakout alerts. No visual zone fill option. Lacks additional filters or Fibo levels.
Diskusi
Pertanyaan umum
Breakout
Produk-produk yang tersedia melalui cTrader Store, termasuk bot trading, indikator, dan plugin, disediakan oleh pengembang pihak ketiga serta hanya ditujukan untuk akses teknis dan informasi. cTrader Store bukan broker dan tidak menyediakan saran investasi, rekomendasi pribadi, atau jaminan apa pun tentang kinerja di masa mendatang.
Produk lain dari penulis ini


![Logo "[Hamster-Coder] Pivot Points MTF"](https://cdn.ctrader.com/image/webp/4c143e5a-309c-40e3-a578-f04d1e133ffa_31159)


Harga
Sejak 24/09/2024
4.47K
Instal gratis