
PivotLevels
Indikator
1 pembelian
Versi 1.0, Sep 2025
Windows, Mac
4.5
Ulasan: 2
Deskripsi
Indikator Titik Pivot
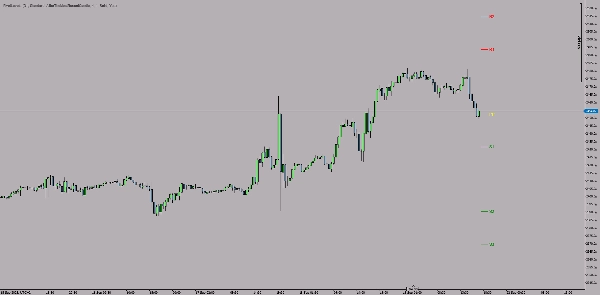
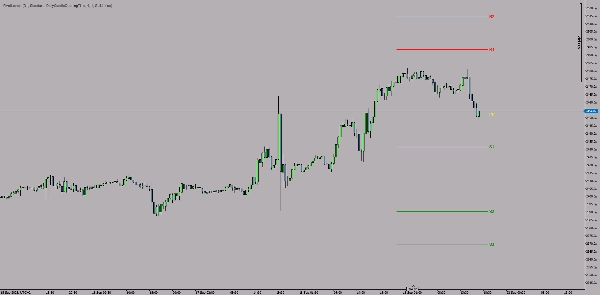
Titik Pivot adalah indikator teknis untuk platform cTrader yang secara otomatis menghitung dan menampilkan titik pivot sebagai garis tren pada grafik.
Fitur Utama:
🎯 Jenis Pivot:
- Titik Pivot Standar
- Titik Pivot Fibonacci
- Titik Pivot Woodie
- Titik Pivot Camarilla
📊 Level:
- Titik Pivot Tengah (PP) - kuning
- Level resistensi (R1, R2, R3) - merah
- Level support (S1, S2, S3) - hijau
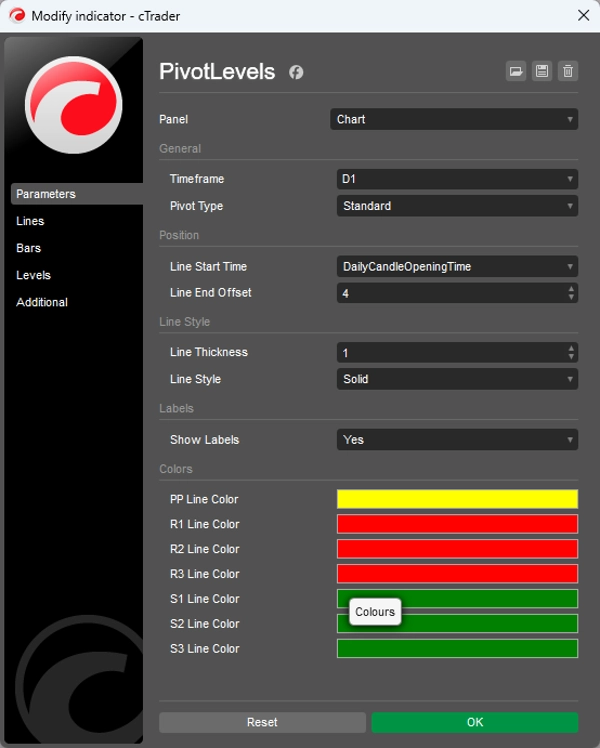
⚙️ Pengaturan yang Dapat Disesuaikan:
- Kerangka waktu: Pilihan harian, mingguan, atau kerangka waktu lainnya
- Gaya garis: Ketebalan (1-5) dan tipe (padat, putus-putus, dll.)
- Posisi: Waktu mulai dan panjang garis
- Warna: Warna setiap level dapat disesuaikan secara individual
- Label: Aktifkan/nonaktifkan label teks
💡 Penggunaan:
Indikator ini menghitung level pivot berdasarkan nilai tertinggi, terendah, penutupan (dan pembukaan) periode sebelumnya (hari/minggu), yang mengidentifikasi area support dan resistensi utama untuk periode perdagangan berikutnya.
Ideal untuk trader swing dan harian yang menerapkan strategi berdasarkan level teknis.
Ringkasan
Ringkasan AI
PivotLevels is a technical indicator for the cTrader platform that automatically calculates and displays pivot points as trendlines on trading charts. It supports multiple pivot point calculation methods, including Standard, Fibonacci, Woodie, and Camarilla pivots. The indicator plots key levels such as the Central Pivot Point (PP) in yellow, resistance levels (R1, R2, R3) in red, and support levels (S1, S2, S3) in green.
Users can customize various settings, including the timeframe for pivot calculation (daily, weekly, or others), line style (thickness and type), line positioning (start time and length), colors for each level, and the option to toggle text labels on or off. The pivot levels are derived from the previous period’s high, low, close, and open prices, helping identify potential support and resistance zones for the upcoming trading period.
This indicator is suitable for traders who use technical levels in their strategies, particularly swing and day traders. It supports multiple markets such as forex, indices, commodities, cryptocurrencies, and stocks.
Profil indikator
Ulasan pelanggan
4.5
Ulasan: 2
5 | 50 % | |
4 | 50 % | |
3 | 0 % | |
2 | 0 % | |
1 | 0 % |
Ulasan pelanggan
September 30, 2025
The review gets easier when the decision feels less rushed, and The setup needs patience.
Diskusi
Pertanyaan umum
Prop
Forex
Indices
Commodities
Crypto
Stocks
Produk-produk yang tersedia melalui cTrader Store, termasuk bot trading, indikator, dan plugin, disediakan oleh pengembang pihak ketiga serta hanya ditujukan untuk akses teknis dan informasi. cTrader Store bukan broker dan tidak menyediakan saran investasi, rekomendasi pribadi, atau jaminan apa pun tentang kinerja di masa mendatang.


Harga
Sejak 05/01/2025
14
Penjualan