
present
Daftar dan dapatkan diskon $50 untuk pembelian pertama Anda
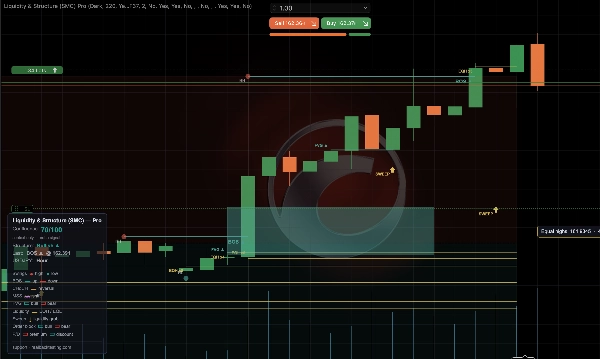
Trading product for Liquidity & Structure (SMC) Pro Indikator Fair Value Gap BOS, image 1
Liquidity & Structure (SMC) Pro
Indikator
4 pembelian
Versi 2.0, Aug 2026
Windows, Mac
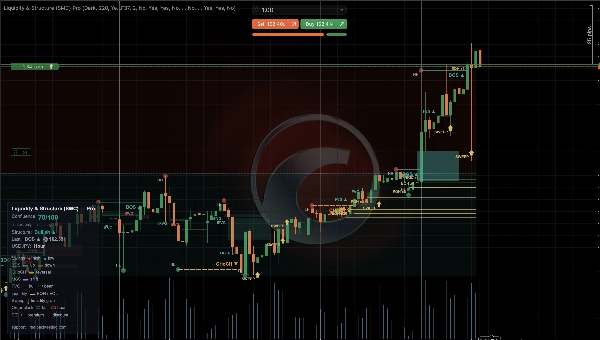
Trading product for Liquidity & Structure (SMC) Pro Indikator Fair Value Gap BOS, image 2
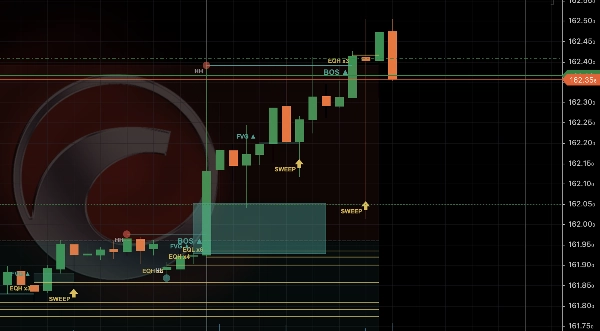
Trading product for Liquidity & Structure (SMC) Pro Indikator Fair Value Gap BOS, image 3
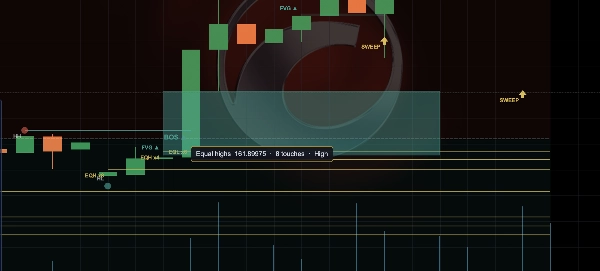
Trading product for Liquidity & Structure (SMC) Pro Indikator Fair Value Gap BOS, image 4
Trading product for Liquidity & Structure (SMC) Pro Indikator Fair Value Gap BOS, image 5
Trading product for Liquidity & Structure (SMC) Pro Indikator Fair Value Gap BOS, image 6
30.48M
Volume trading
12.32K
Pip dimenangkan
25
Penjualan
2.1K
Instal gratis

Deskripsi

Dokumentasi lengkap, setiap pengaturan dan semua data secara lebih rinci di situs web kami - realbacktesting.com


Liquidity & Structure (SMC) (Pro) — rangkaian lengkap Smart-Money-Concepts untuk cTrader. Tidak melakukan repaint, dan mengukur dirinya sendiri.


Satu indikator bersih menggambar seluruh gambaran SMC: struktur pasar (BOS / CHoCH / MSS), celah nilai wajar, kolam likuiditas dan sapuan, blok order, premium/diskon — dan skor konfluensi 0–100 sehingga Anda dapat melihat sekilas kapan semuanya sejajar. Setiap elemen memiliki tooltip harga saat diklik. Ini tidak pernah melakukan repaint. Dan menjawab pertanyaan yang ditinggalkan oleh setiap alat SMC lainnya: apakah ini benar-benar bekerja di grafik SAYA?


APA YANG DILAKUKANNYA

✅ Struktur pasar — BOS / CHoCH / MSS, berlabel otomatis

✅ Celah nilai wajar — digambar, status terisi dilacak, FVG terbalik, filter ukuran minimum

✅ Likuiditas — puncak / dasar yang sama, sapuan perburuan stop dengan konfirmasi penolakan sumbu

✅ Blok order — dengan filter perpindahan dan kualitas badan

✅ Premium / diskon — di mana harga berada di dalam rentang ayunan saat ini

✅ Struktur multi-timeframe — baca timeframe yang lebih tinggi tanpa meninggalkan grafik

✅ Skor konfluensi 0–100 — konteks, bukan pemicu masuk

✅ Tooltip harga saat diklik — level tepat pada setiap elemen

✅ Tidak melakukan repaint · warna, lebar, opasitas, dan lapisan yang dapat dikonfigurasi

✅ Peringatan — popup, suara, email, dan Telegram, per kejadian


KEANDALAN TERUKUR — apa yang tidak dilakukan oleh alat lain dalam kategori ini

Pada bar Anda sendiri, ini menghitung seberapa sering harga bereaksi pada setiap blok order, celah, dan sapuan, dan mencetak tingkatnya di samping ukuran sampelnya. Kemudian melangkah lebih jauh:

▸ Terpecah berdasarkan sesi — tiga sesi, jendela Anda sendiri, masing-masing dibaca dalam jam pasar mereka sendiri, sehingga pergeseran musim panas diterapkan untuk Anda

▸ Kalibrasi otomatis — ini menyapu 12 pengaturan perpindahan/badan dan melaporkan yang terbaik untuk simbol Anda BERSAMA DENGAN median sapuan. Terbaik yang jauh di atas median adalah varians, bukan keunggulan, dan sekarang Anda dapat melihat perbedaannya

▸ Perbandingan entri FVG — keunggulan dekat dibandingkan menunggu 50%, stop yang sama, kedua tingkat ditampilkan

▸ Penundaan sentuhan — persentil ke-50 / 75 / 90 dari berapa lama sebuah level membutuhkan waktu untuk terkena

▸ Filter kualitas yang menghentikan penggambaran blok order di bawah tingkat hit yang terukur


Ini adalah hitungan reaksi harga pada candle yang tertutup: bukan entri, bukan stop, bukan biaya. Bukan hasil strategi — sebuah angka yang dapat Anda ulangi.


MENGAPA INI MENAMBAHKAN NILAI

Sebagian besar alat SMC menggambar satu atau dua hal dan melakukan repaint pada sisanya. Ini adalah tumpukan lengkap dalam satu overlay tanpa repaint, dengan 80 parameter yang masing-masing menjelaskan dirinya sendiri di panel — dan, di atas segalanya, dengan kejujuran mengukur zona sendiri daripada meminta Anda mempercayainya.


HARGA

$29 — satu kali, seumur hidup. Tidak ada langganan, tidak ada sewa.


Edisi gratis tersedia — struktur, celah, blok order, likuiditas, premium/diskon dan pengukuran — sehingga Anda dapat mencobanya di grafik Anda sendiri terlebih dahulu: ctrader.com/products/4702


CARA MENGGUNAKAN

1. Tambahkan ke cTrader → grafik → Indikator → "Liquidity & Structure (SMC)".

2. Beri beberapa detik untuk memuat riwayat agar pengukuran lengkap.

3. Baca "Pengaturan terbaik di sini" dan terapkan ke simbol Anda.

4. Klik elemen apa pun untuk membaca harga tepatnya. Ini memetakan grafik secara langsung dan tidak pernah melakukan repaint.


== APA YANG AKAN DATANG ==

Indikator ini memetakan dan mengukur. Ini tidak menentukan ukuran, stop, atau duduk diam untuk Anda — itu adalah setengah lainnya, dan itulah yang diotomatisasi oleh portofolio cBot kami, dengan paritas Python/C# yang diverifikasi dan hasil yang dilacak langsung oleh cTrader:

👉 Balanced FTMO Swing, edisi gratis, uji coba dengan biaya Anda sendiri: ctrader.com/products/4615


Ringkasan

AI summary
Liquidity & Structure (SMC) Pro is a comprehensive Smart Money Concepts indicator designed for the cTrader platform. It integrates multiple market analysis elements into a single, no-repaint overlay, including market structure components such as Break of Structure (BOS), Change of Character (CHOCH), and Market Structure Shifts (MSS). The indicator automatically labels these structures and visually represents fair-value gaps (FVG) with tracked fill states.

It identifies liquidity pools, sweeps, and grabs, highlighting stop-run events, and marks bullish and bearish order blocks. A unique feature is the 0–100 confluence score, which quantifies the alignment of various SMC signals to help users quickly assess the strength of combined market factors. Each structural element, order block, and fair-value gap includes on-click price tooltips for precise level reading.

The indicator is configurable, allowing customization of colors, widths, opacity, and which elements to display. It operates live on charts without repainting, ensuring that displayed signals remain consistent after they appear. This tool consolidates the full SMC suite into one interface, facilitating detailed market structure analysis and liquidity assessment for traders using cTrader.

Profil indikator
Kategori indikator
Struktur pasar (SMC)
Tipe output
Visualisasi
Sinyal
Persyaratan data
Hanya batang
Data tick
Sinyal yang didukung
Level tertembus
Level tersentuh

Ulasan pelanggan

0.0
Ulasan: 0
Ulasan pelanggan
Belum ada ulasan untuk produk ini. Sudah mencobanya? Jadilah pemberi ulasan pertama!

Diskusi

Pertanyaan umum

Fair Value Gap
BOS
Liquidity Sweep
CHOCH
Produk-produk yang tersedia melalui cTrader Store, termasuk bot trading, indikator, dan plugin, disediakan oleh pengembang pihak ketiga serta hanya ditujukan untuk akses teknis dan informasi. cTrader Store bukan broker dan tidak menyediakan saran investasi, rekomendasi pribadi, atau jaminan apa pun tentang kinerja di masa mendatang.

Produk lain dari penulis ini

Indikator
BOS
CHOCH
+2
Free SMC on your chart: BOS / CHoCH / MSS structure and fair-value gaps. No repaint, and it measures itself.
cBot
Balanced
TP Manager
+5
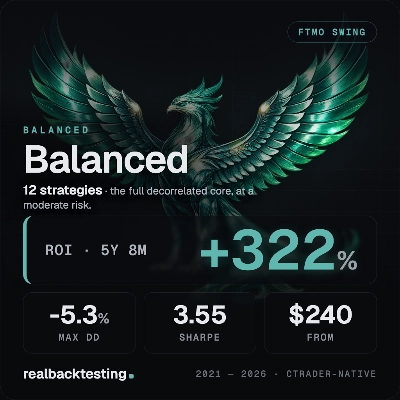
12-strategy portfolio. +322.2% in 5Y8M at -5.26% max DD. No grid. No martingale. Verify every result in your cTrader.
1.67
Faktor laba
cBot
ATR
Aggressive
+5
FREE backtest-only. Reproduce Pegasus Gold's +156.13% in your own cTrader. Same engine, same book. No grid.
2.33
Faktor laba
cBot
Prop Firm Fit
Drawdown Guard
+5
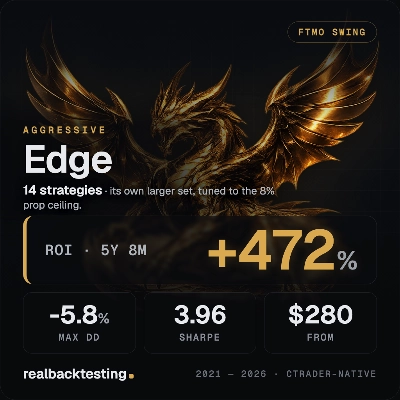
14-strategy portfolio. +472.4% in 5Y8M at -5.78% max DD. No grid. No martingale. Verify every result in your cTrader.
1.64
Faktor laba
Indikator
Key Levels
Market Structure
+1
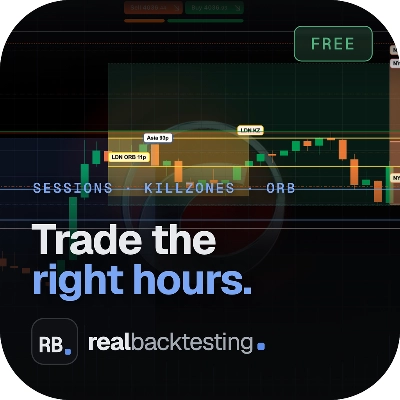
Free: Asia / London / NY sessions, ICT killzones and the opening range. One clean, no-repaint cTrader overlay.
Indikator
Key Levels
Market Structure
+1
Sessions, ICT killzones, multi-ORB and previous levels. One clean, no-repaint cTrader overlay.
cBot
SL Manager
Break Even
+5
FREE backtest-only. Reproduce Edge's +472.4% in your own cTrader. Same engine, same book. No grid, no martingale.
1.64
Faktor laba
cBot
ATR
Aggressive
+5
8-strategy portfolio. +434.98% in 2Y6M at -17.46% max DD. No grid. No martingale. Verify every result in your cTrader.
1.57
Faktor laba
cBot
ATR
Balanced
+5
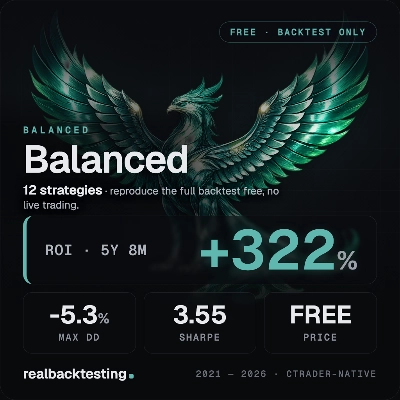
FREE backtest-only. Reproduce Balanced's +322.2% in your own cTrader. Same engine, same book. No grid, no martingale.
1.67
Faktor laba
Plugin desktop
Market Scanner
An 8-currency strength ranking, multi-TF heatmap and impulse tracker. Read the real driver at a glance. Read-only.
cBot
ATR
Aggressive
+5
FREE backtest-only. Reproduce Pegasus Nasdaq's +434.98% in your own cTrader. Same engine, same book. No grid.
1.57
Faktor laba
cBot
ATR
Aggressive
+5
11-strategy portfolio. +156.13% in 2Y6M at -8.48% max DD. No grid. No martingale. Verify every result in your cTrader.
2.33
Faktor laba

Anda mungkin juga suka

Indikator
EMA
Volume
+4
Advanced volume‑profile tool with delta, HVN/LVN zones, and precise POC‑based trade signals.
Indikator
Doji
Wedge
+5
Angora Pattern Recognition is a cTrader indicator that finds, draws and tracks classic chart patterns automatically.
Indikator
Forex
BTCUSD
+8
The traditional Hull Moving Average with different colours based on the slope (direction) of the trend.
Indikator
Supertrend
Moving Average
Easy Trade: Trend & Breakout Indicator for cTrader
Indikator
MACD
Prop
+14
Customize the MACD! Choose colors, get real-time tick updates, and see crossover points for enhanced trading precision.
Indikator
EMA
Volume
Map range high, mid, low, price location and a deterministic pressure proxy on your cTrader chart.
Indikator
ATR
RSI
+6
Market structural patterns , specifically the concepts of Change of Character (ChoCH) 🔄 and Break of Structure (BoS) 💥
Indikator
ATR
RSI
+5
Delta RSI Candle Pro, the indicator that transforms ordinary candlesticks into powerful momentum visualizers.
Indikator
Volume
Moving Average
Multi-Timeframe Rolling Volatility Indicator - Smart Volatility Breakout System
Indikator
Crypto
Signal
+3
Candlestick Signal Finder: cTrader indicator that automatically detects and color-codes key Japanese candlestick pattern
Indikator
BOS
Add standard-timeframe context candles to a native Renko chart.
Indikator
Forex
BTCUSD
+5
Multi-timeframe moving averages with session lines for structured trend analysis directly on the chart.
Indikator
ATR
RSI
+3
🚀 Specialized algorithm is designed to confirm entry and exit points with precision 🎯
Indikator
XAUUSD
Commodities
A Fair Value Gap (FVG) indicator that identifies potential price imbalances, potential reversal and continuation zones
Indikator
RSI
MACD
+7
The ZigZag indicator is a technical analysis tool primarily used to identify key price reversal points.
Indikator
Indices
this indicator shows previous day high low and closed with precise manner.
Indikator
Volume
Key Levels
+4
Session & Kill Zone Highlighter - Visual tool for London, NY, Tokyo, Sydney sessions plus ICT Kill Zones.
Indikator
Breakout
Allow trader to visualize Support & Resistance across different timeframes,give trader an overview of the current market

Harga

30.48M
Volume trading
12.32K
Pip dimenangkan
25
Penjualan
2.1K
Instal gratis