
Описание
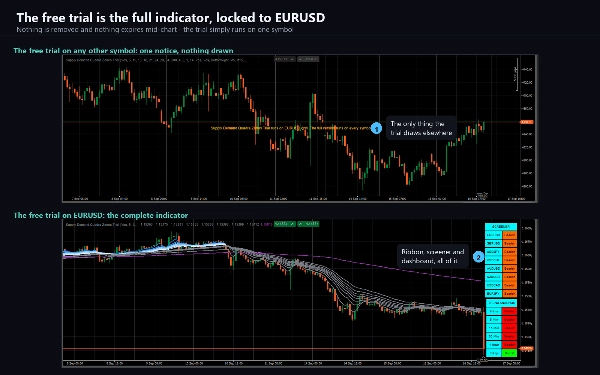
Supply Demand Quadra Zones отображает сигнал входа, разработанный план риска и ваш более широкий рыночный контекст на одном графике.
ЧТО ОТОБРАЖАЕТСЯ
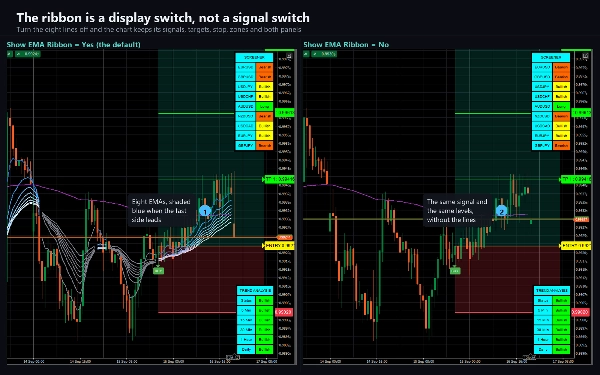
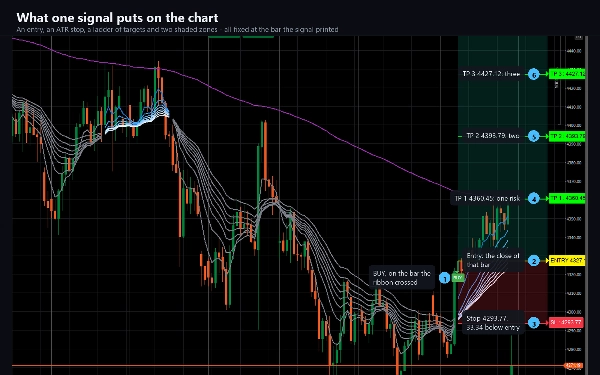
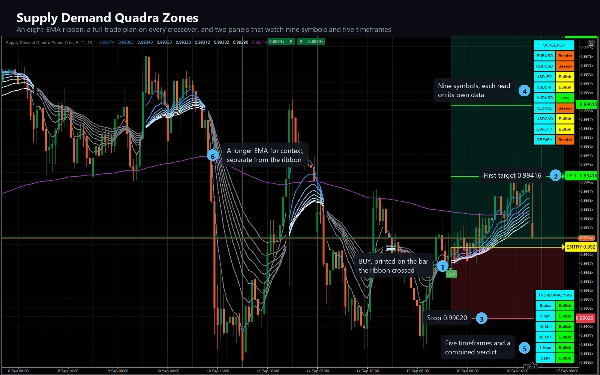
Лента EMA из восьми линий (5, 11, 15, 18, 21, 24, 28, 34), которая становится синей, когда быстрая часть ведет, и серой, когда не ведет, плюс эталонная линия на 200 периодов. Когда EMA 2 пересекает EMA 8 сверху, рисуется метка BUY; при обратном пересечении появляется метка SELL.
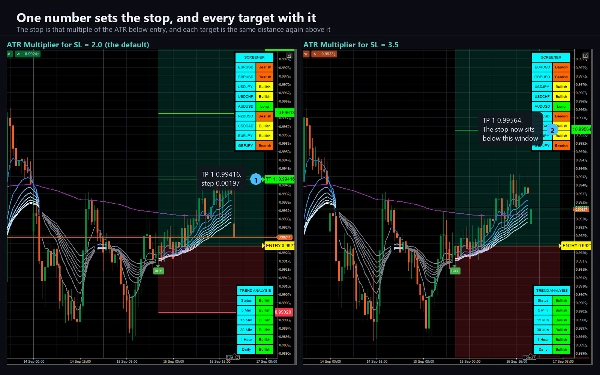
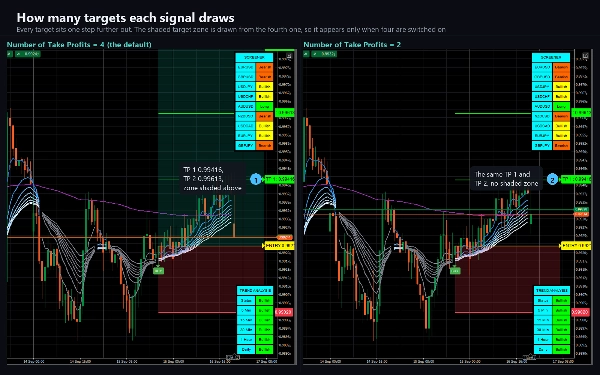
Каждый сигнал сопровождается полным планом риска, уже нанесённым на график: линия входа, стоп, установленный на основе множителя ATR, и до четырёх уровней тейк-профита, расположенных как кратные расстояния стопа. При стандартных настройках уровни составляют 1R, 2R, 3R и 4R. Каждый уровень имеет свою ценовую отметку на правом краю, а пространство между входом и целью и между входом и стопом затенено, чтобы форма сделки была читаема с первого взгляда. Весь план движется вместе с ценой и фиксируется, когда сделка закрывается — либо срабатывает стоп, либо достигаются все активные цели.
ДВА ПАНЕЛЯ
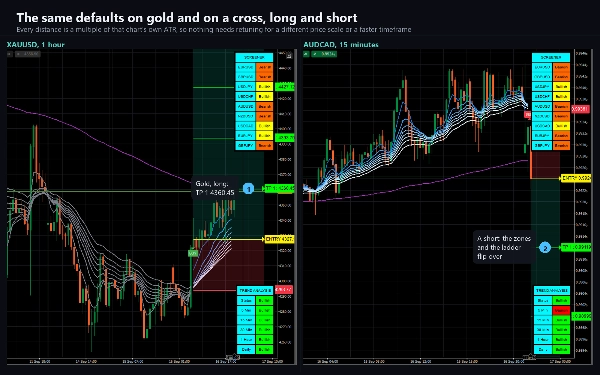
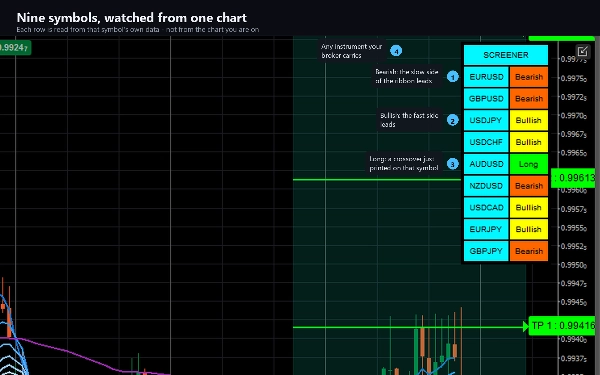
Скринер классифицирует до девяти выбранных вами символов — все они считываются на таймфрейме самого графика — как Long, Short, Bullish или Bearish, чтобы вы могли видеть, какие другие рынки выстраиваются аналогично, не открывая девять графиков.
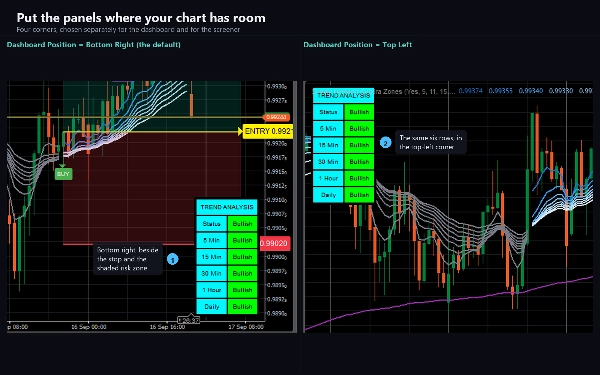
Панель трендов отображает направление на 5-минутном, 15-минутном, 30-минутном, 1-часовом и дневном таймфреймах для символа графика, а также объединённую строку Статуса, определяемую большинством голосов трёх выбранных вами таймфреймов.
WEBHOOK
Каждый сигнал и каждый шаг последующей сделки могут быть отправлены POST-запросом в формате JSON на выбранный вами URL — так внешний бот, журнал или сервис уведомлений могут реагировать на них без необходимости наблюдения за графиком. Отправляются сторона сделки, вход, стоп и полный набор целей, затем сообщения для каждой достигнутой цели, для стопа и для закрытия сделки. Функция отключена, пока вы не заполните URL, не срабатывает при загрузке истории или во время бэктеста и не требует повышенных прав.
Оповещения также выводятся через журнал cTrader, звуковой сигнал и электронную почту.
ПЕРЕРИСОВКА, ПРОСТО И ЯСНО
Сигналы BUY и SELL не перерисовываются. Они определяются на закрытых барах и никогда не меняются после отображения.
Два панеля перерисовываются. Оба рисуются на живом баре и считывают развивающиеся данные таймфреймов выше, поэтому их ячейки могут изменяться до закрытия этих баров. Рассматривайте их как живую картину текущей ситуации, а не как запись произошедшего.
НАСТРОЙКИ
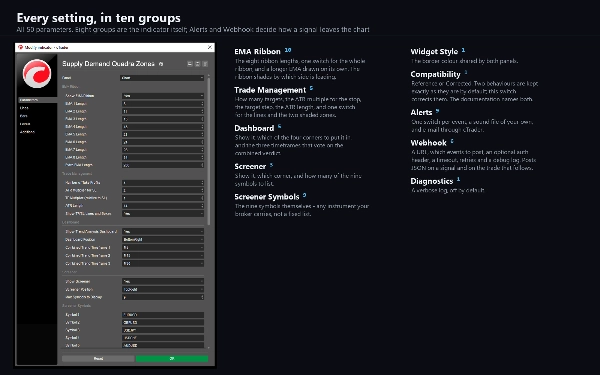
50 параметров. Все восемь длин ленты, множитель ATR и расстояние между целями, количество целей, позиции обоих панелей, все девять символов скринера, три таймфрейма панели, цвет рамки, каналы оповещений и webhook. Настройка Совместимости выбирает между двумя режимами для опции панели 4 часа и затенённой зоны цели — документация подробно объясняет, что делает каждый режим и почему по умолчанию выбран именно он.
ПОДХОДИТ ДЛЯ
Любого инструмента и любого таймфрейма, доступного на платформе. Лента требует 34 бара для полного формирования и 200 для эталонной линии, поэтому очень короткая история покажет меньше линий, чем длинная.
Торговля связана с риском. Прошлые результаты не гарантируют будущих.
Сводка
Each trade signal includes a comprehensive risk plan displayed directly on the chart, consisting of an entry line, a stop loss set at a multiple of the Average True Range (ATR), and up to four take-profit levels spaced by multiples of the stop distance. These levels are visually shaded and labeled with price tags for clarity. The risk plan dynamically tracks price movement and freezes upon trade resolution.
The product also includes two panels: a screener monitoring up to nine user-selected symbols on the current timeframe, classifying them as Long, Short, Bullish, or Bearish; and a trend dashboard showing directional trends across five timeframes (5m, 15m, 30m, 1h, daily) with a combined status based on a majority vote of three user-chosen timeframes.
Signals and trade steps can be sent as JSON via webhook to external services for automation or logging. Alerts are available through platform logs, sound, and email. Buy and sell signals are confirmed on closed bars and do not repaint, while the screener and dashboard update live and may change until bar close. The indicator offers extensive customization with 50 parameters covering ribbon settings, ATR multiples, target spacing, panel positions, symbols, alert channels, and webhook configuration.






















![Логотип продукта "Smart Money Concepts (SMC) [Iridio Capital]"](https://cdn.ctrader.com/image/webp/b4b5414d-a5ca-44b7-a947-e28eca44a218_61548)