
Deskripsi
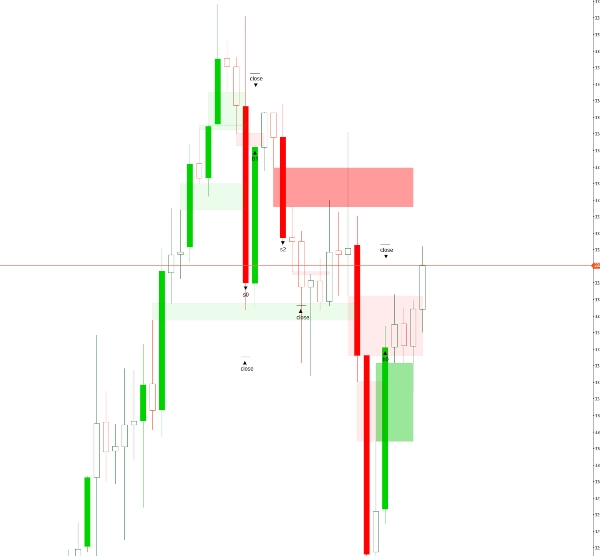
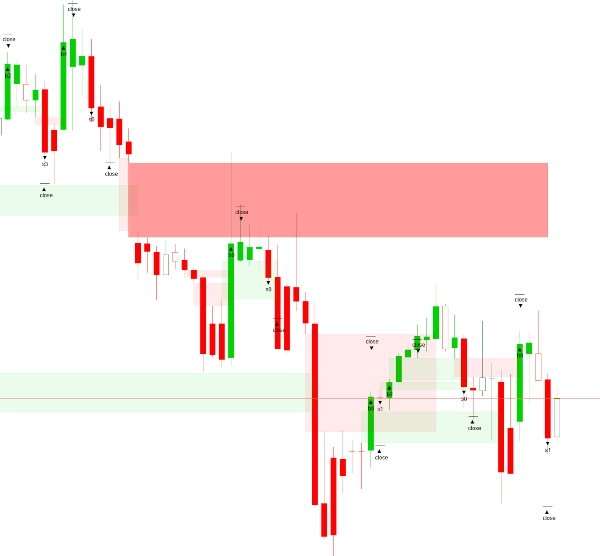
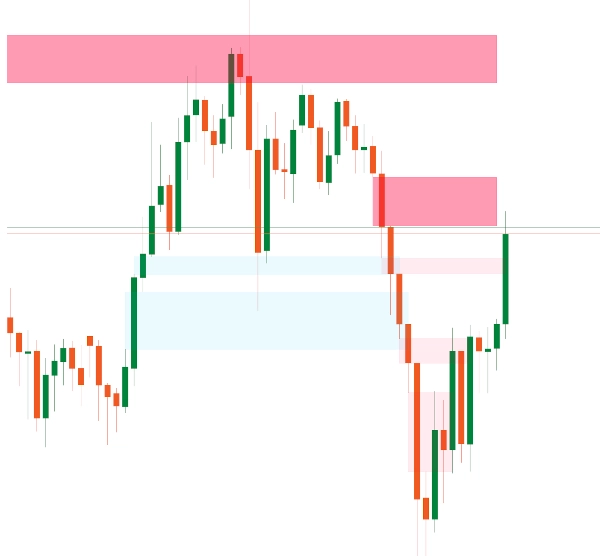
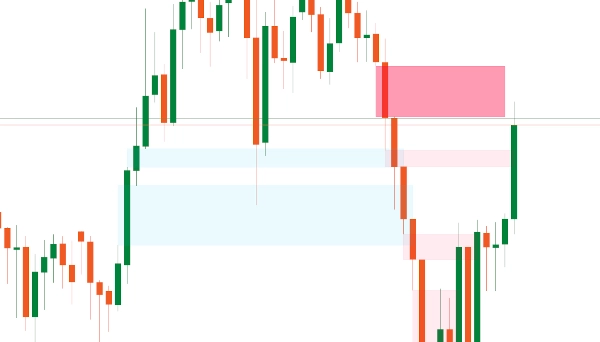
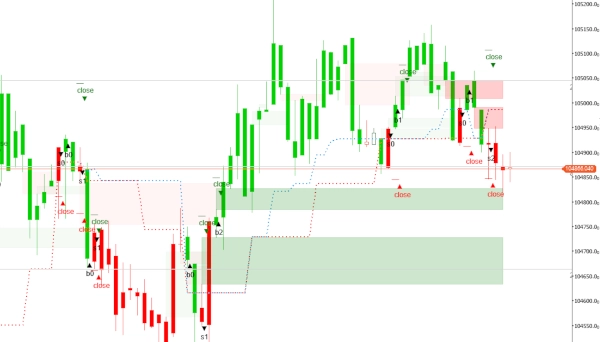
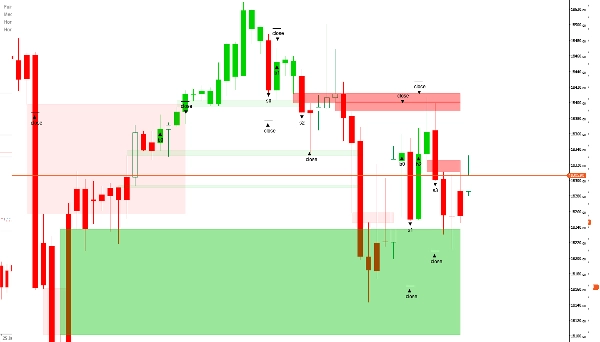
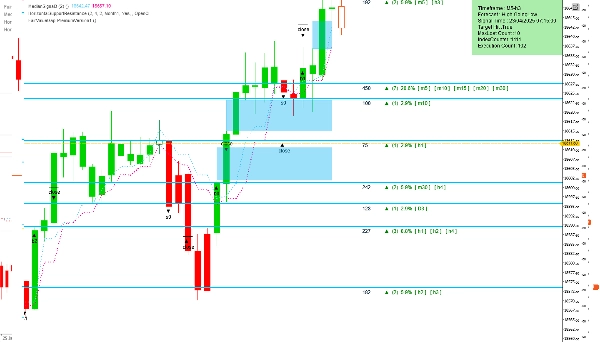
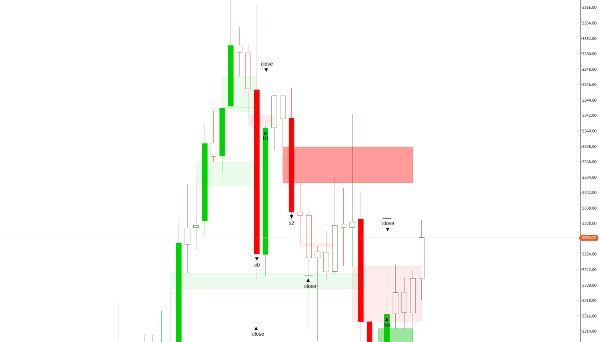
Indikator Fair Value Gap (FVG) ini adalah alat analisis teknikal yang dirancang untuk mendeteksi ketidakefisienan harga dalam pasar keuangan. Ini mengidentifikasi area di mana harga melonjak atau turun dengan cepat, meninggalkan “celah” — zona dengan sedikit atau tanpa aktivitas perdagangan. Celah ini sering menandakan ketidakseimbangan sementara antara penawaran dan permintaan, menunjukkan bahwa harga mungkin akhirnya kembali untuk “mengisi” kekosongan saat pasar mencari keseimbangan. Biasanya, FVG dikenali ketika candle harga ditutup secara signifikan di atas harga tertinggi atau di bawah harga terendah candle sebelumnya tanpa tumpang tindih, menunjukkan area reaksi potensial. Perilaku ini sering dikaitkan dengan perdagangan institusional atau aktivitas algoritmik. Sementara sebagian besar versi indikator ini menganalisis ketidakseimbangan pada satu kerangka waktu, versi premium menambahkan fleksibilitas dengan mendeteksi dan menampilkan celah dari kerangka waktu yang lebih tinggi atau lebih rendah langsung pada grafik saat ini, memberikan konteks yang lebih dalam untuk analisis multi-kerangka waktu.
Ikhtisar Pengaturan
- Bars To Load: Menentukan jumlah bar historis yang akan dianalisis, mulai dari yang paling baru selesai dan bergerak mundur.
- Bullish FVG Color: Mengatur warna untuk FVG yang muncul dalam tren naik. Transparansi 30% diterapkan agar elemen di belakang celah tetap terlihat.
- Bearish FVG Color: Mengatur warna untuk FVG yang muncul dalam tren turun, juga dengan transparansi 30% untuk visibilitas grafik yang lebih baik.
Fitur Premium (Tersedia di Versi Berbayar)
- Delete Closed Gaps: Pengaturan Boolean—ketika diaktifkan ("yes"), secara otomatis menghapus semua celah yang sudah tertutup; jika dinonaktifkan ("no"), celah tetap terlihat. Ini sangat berguna pada kerangka waktu yang lebih rendah (di bawah 20 menit).
- Edit/Remove Gaps: Memungkinkan trader untuk menyesuaikan atau menghapus celah secara manual. Ini memberikan kontrol lebih besar bagi trader berpengalaman, terutama karena celah yang sangat kecil biasanya memiliki pengaruh sedikit pada pergerakan harga.
- Set Timeframe: Menawarkan dua opsi—gunakan kerangka waktu grafik saat ini atau pilih yang berbeda untuk analisis, sambil tetap menampilkan hasil pada grafik utama. Fitur ini membantu trader mendapatkan wawasan lebih cepat tentang kemungkinan pergerakan pasar.
- Selected Timeframe: Menentukan kerangka waktu yang diinginkan untuk analisis jika "Selected Timeframe" dipilih pada pengaturan di atas.
- Small Gap Accuracy: Memungkinkan trader memasukkan ukuran celah yang diinginkan sebagai bilangan bulat, membantu mereka mengidentifikasi celah yang secara historis menghasilkan hasil yang menguntungkan. Nilai ini didasarkan pada seluruh dataset dan ukuran celah yang diamati untuk aset tersebut.
Secara default, indikator memindai semua ketidakseimbangan dalam satu kerangka waktu. Namun, akses ke fitur premium melalui FairValueGapPremium versi dapat sangat meningkatkan kemampuan analisis.
Ringkasan
This indicator detects such gaps to highlight potential reaction zones. By default, it analyzes imbalances within a single timeframe. The premium version enhances functionality by allowing detection and display of FVGs from higher or lower timeframes directly on the current chart, supporting multi-timeframe analysis.
Key settings include the number of historical bars to analyze and customizable colors for bullish and bearish gaps with transparency for chart clarity. Premium features offer options to automatically delete closed gaps, manually edit or remove gaps, select analysis timeframes independent of the chart’s timeframe, and specify gap size accuracy to focus on significant gaps.
This tool aids traders in identifying price inefficiencies and probable market reaction areas through detailed gap analysis across multiple timeframes.
Ulasan pelanggan
5 | 100 % | |
4 | 0 % | |
3 | 0 % | |
2 | 0 % | |
1 | 0 % |


