Deskripsi
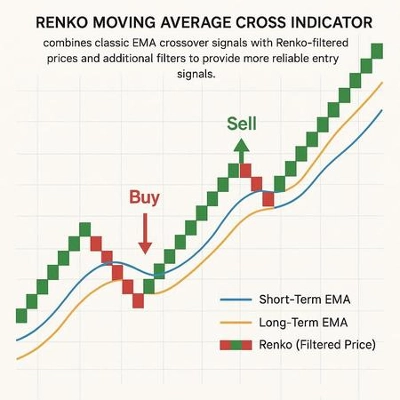
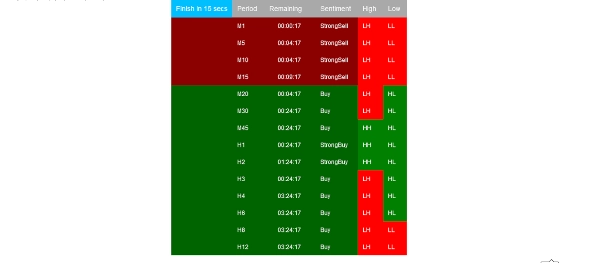
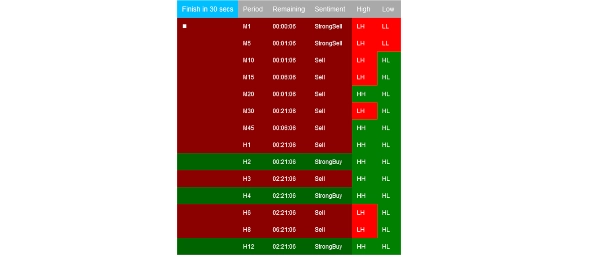
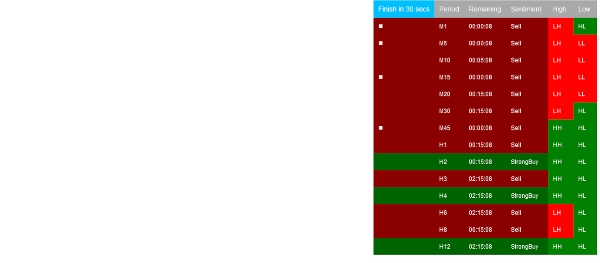
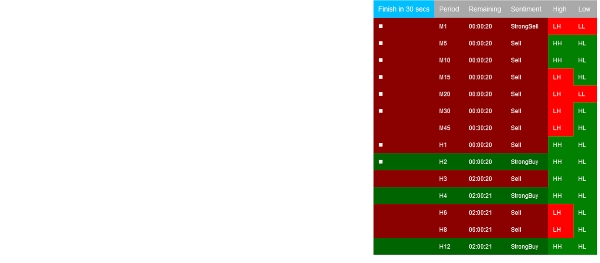
Indikator Grafik Sentimen Bar ini adalah alat analisis teknikal yang mengukur kekuatan dan arah sentimen pasar berdasarkan bar demi bar (atau lilin demi lilin). Ini memeriksa hubungan antara harga buka, tinggi, rendah, dan tutup setiap bar untuk menentukan apakah pasar menunjukkan perilaku bullish, bearish, atau netral selama periode waktu tersebut.
Biasanya, sentimen bullish diidentifikasi ketika harga penutupan berakhir jauh lebih tinggi daripada harga buka, menunjukkan tekanan beli yang kuat. Sentimen bearish terdeteksi ketika harga penutupan secara signifikan lebih rendah daripada harga buka, menandakan tekanan jual yang kuat. Bar netral, yang sering disebut "doji," mencerminkan ketidakpastian atau keseimbangan antara pembeli dan penjual.
Versi lanjutan dari Indikator Sentimen Bar mungkin menggabungkan elemen tambahan seperti volume, ukuran tubuh relatif, atau momentum untuk menyempurnakan klasifikasi sentimen. Sentimen sering divisualisasikan melalui pewarnaan—hijau untuk bullish, merah untuk bearish, dan abu-abu atau biru untuk netral—memudahkan penilaian cepat terhadap nada pasar yang berlaku.
Jika 1 dan 0 adalah blok bangunan dari rekayasa perangkat lunak, maka keluaran dari Indikator Grafik Sentimen Bar mewakili blok bangunan fundamental dari sistem perdagangan pembelajaran mesin tingkat lanjut. Dengan mengkuantifikasi sentimen pasar mentah, ini menyediakan input penting untuk algoritma yang berusaha mempelajari dan memprediksi pergerakan harga di masa depan berdasarkan perilaku historis.
Dengan menggunakan Indikator Grafik Sentimen Bar, para pedagang mendapatkan pemahaman yang lebih dalam tentang dinamika mikro pasar, membantu mereka mengidentifikasi kekuatan tren, potensi pembalikan, dan periode konsolidasi—terutama ketika dikombinasikan dengan analisis multi-timeframe dan alat teknikal lainnya.
Ringkasan
Advanced versions may integrate factors like volume, relative body size, or momentum to enhance sentiment accuracy. The indicator typically uses color-coding—green for bullish, red for bearish, and gray or blue for neutral—to visually represent market tone. By quantifying raw market sentiment, it provides foundational data useful for machine learning trading systems aiming to predict future price movements.
Traders can use this indicator to gain insight into micro market dynamics, helping to identify trend strength, potential reversals, and consolidation phases. It is particularly effective when combined with multi-timeframe analysis and other technical tools.
Ulasan pelanggan
5 | 100 % | |
4 | 0 % | |
3 | 0 % | |
2 | 0 % | |
1 | 0 % |