Описание
Impulse Matrix Pro 🚀
Что это?
https://chartshots.spotware.com/c/69d5282dc32e0
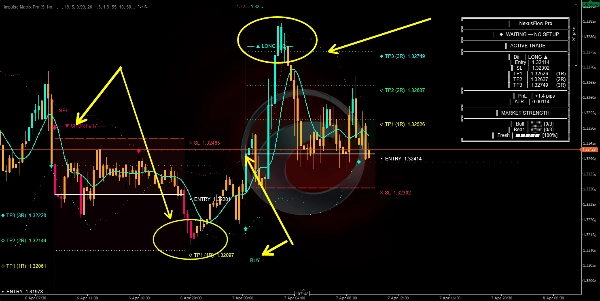
Impulse Matrix Pro — это индикатор-оверлей, который генерирует сигналы на покупку и продажу 📈📉 только когда три независимых движка одновременно согласны. Он объединяет обнаружение тренда, импульсные прорывы и умные фильтры в единую систему с встроенными уровнями управления рисками 🛡️.
https://chartshots.spotware.com/c/69d5293d873fa
Три движка ⚙️
https://chartshots.spotware.com/c/69d5288a347ea
Движок 1 — Тренд (SMEMA) 🌊
Двойная сглаженная скользящая средняя (экспоненциальная → затем простая) создает Линию Nexus.
- Если она растет → тренд бычий 🟢.
- Если падает → медвежий 🔴.
Вокруг нее рисуются 3 конвертных полосы сверху и снизу, отстоящие на расстояние, равное сглаженному диапазону свечи. Положение цены относительно этих полос определяет силу (0–3):
Сила
Значение
1/3
Цена за пределами Полосы 1
2/3
Цена за пределами Полосы 2
3/3
Цена за пределами Полосы 3 ⚡
Более высокий минимальный уровень силы = меньше, но более качественных сигналов
Движок 2 — Импульс (BOSWaves)
Обнаруживает события нарушения структуры с помощью динамических полос, построенных на основе:
- EMA базовой линии
- Среднего абсолютного отклонения (MAD) как единицы волатильности
Ключевое поведение: Полосы сжимаются после сильных движений (проще сработать) и расширяются во время консолидации (сложнее сработать). Это контролируется оценкой свежести импульса, которая со временем уменьшается ⏳.
- Бычий прорыв: Предыдущее закрытие ≤ верхней полосы, текущее закрытие пересекает ее сверху 🚀.
- Медвежий прорыв: Предыдущее закрытие ≥ нижней полосы, текущее закрытие пересекает ее снизу 📉.
Движок 3 — Умные фильтры 🛡️
Три фильтра, которые должен пройти каждый сигнал:
- Волатильность ATR: Рынок имеет достаточное движение для торговли 🌊
- Импульс: Цена действительно движется в направлении сигнала за N баров 🏃♂️
- Свежесть: Импульс не ослабел — движение еще "живое" 🔥
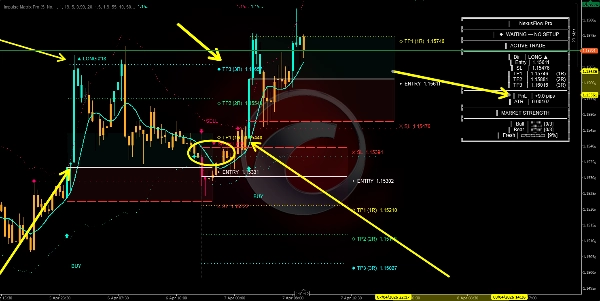
Условия сигнала 🚦
ПОКУПКА — все 7 условий должны быть истинны: ✅
- Линия Nexus растет
- Сила быков ≥ минимального порога
- Обнаружен бычий прорыв импульса
- Направление сменилось с медвежьего на бычье
- Фильтр ATR пройден
- Импульс подтверждает движение вверх
- Свежесть импульса выше порога
ПРОДАЖА — все 7 условий должны быть истинны: ✅
- Линия Nexus падает
- Сила медведей ≥ минимального порога
- Обнаружен медвежий прорыв импульса
- Направление сменилось с бычьего на медвежье
- Фильтр ATR пройден
- Импульс подтверждает движение вниз
- Свежесть импульса выше порога
Примечание: Если хотя бы одно условие не выполнено → сигнала нет ❌.
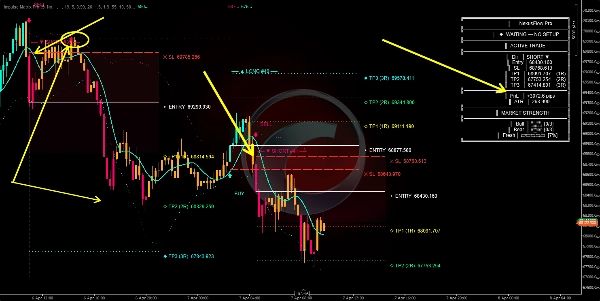
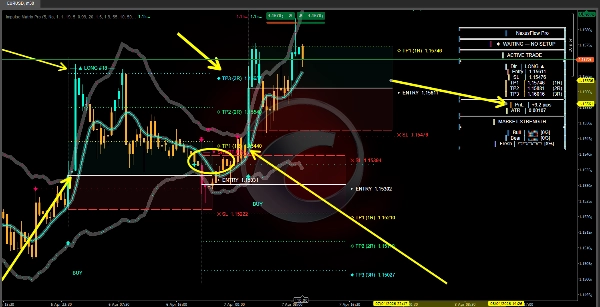
Логика стоп-лосса и тейк-профита 📏
Все уровни основаны на ATR и полностью адаптивны к текущей волатильности 🔄.
- Расстояние стоп-лосса = ATR × множитель SL (по умолчанию 1.5)
Уровень
Расчет
Стандартное соотношение риск/прибыль
SL
Вход ∓ (ATR × 1.5)
— 🛑
TP1
Вход ± (расстояние SL × 1.0)
1:1 🎯
TP2
Вход ± (расстояние SL × 2.0)
1:2 🎯🎯
TP3
Вход ± (расстояние SL × 3.0)
1:3 💰
Волатильные рынки → более широкие стопы и цели. Тихие рынки → более узкие уровни. Все масштабируется автоматически ⚖️.
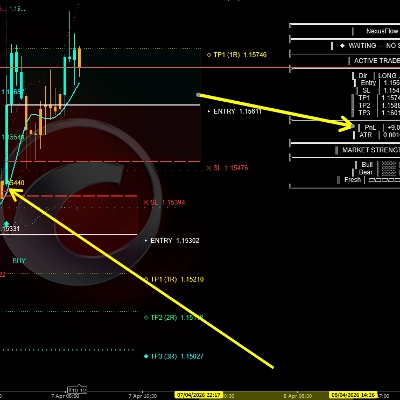
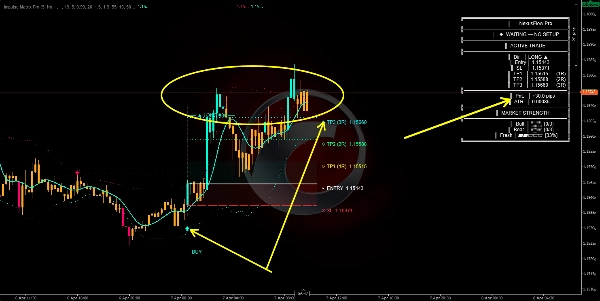
Визуальные элементы 🎨
- Линия Nexus: Центральное направление тренда 🧵
- Конвертные полосы: Зоны измерения силы с градиентной заливкой 📊
- Импульсные полосы (пунктирные): Динамические пороги прорыва 🏁
- Стрелки ПОКУПКА / ПРОДАЖА: Подтвержденные сигналы входа 🏹
- Белые ромбы: Точки смены тренда на линии Nexus 💎
- Линии входа / SL / TP: Проектируемые уровни сделки 📐
- Красная зона: Зона риска (от входа до SL) ⚠️
- Зеленая/голубая зона: Зона прибыли (от входа до TP1) 🏆
- Звезды + горизонтальные линии: Сигналы ретеста — цена возвращается к импульсной полосе без ее пробоя ⭐
- Облако тренда: Легкая фоновая заливка, показывающая доминирующее направление ☁️
- Цвета баров: Голубой = бычий · Розовый = медвежий · Оранжевый = нет сигнала 🎨
- Информационная панель (вверху справа): Данные по сделке в реальном времени, PnL, индикаторы силы, шкала свежести 🖥️
Как использовать 📖
- Ждите стрелку ПОКУПКА/ПРОДАЖА 🏹 — оранжевые бары означают отсутствие сигнала, не входите 🛑.
- Проверьте панель 🖥️ — большая сила и свежесть = большая уверенность.
- Торгуйте по проектируемым уровням 📏 — SL там, где указано, берите частичные прибыли на TP1/TP2, остальное оставляйте до TP3.
- Ретестовые звезды ⭐ можно использовать как дополнительные возможности для существующей позиции.
- Противоположный сигнал 🔄 = предыдущая сделка концептуально аннулируется.
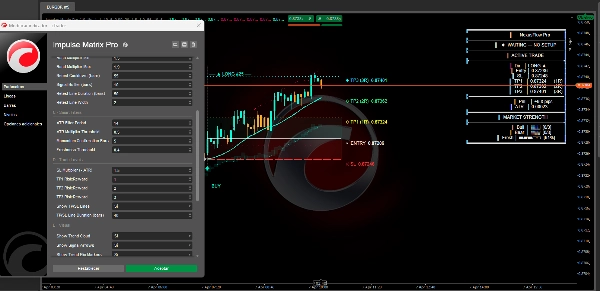
Ключевые параметры ⚙️
Параметр
Большее значение
Меньшее значение
Период цикла
Более сглаженный тренд, более медленные сигналы
Быстрее, более реактивно ⚡
Мин. сила
Меньше сигналов, более строгий фильтр
Больше сигналов, меньше фильтрации 🔍
Длина EMA тренда
Более сглаженная базовая линия импульса
Более реактивные прорывы 🌊
Множители полос
Шире импульсные полосы, меньше прорывов
Узкие полосы, больше прорывов 📏
Порог ATR
Требуется более высокая волатильность 🌪️
Разрешены сигналы при низкой волатильности
Порог свежести
Только свежие импульсы проходят 🔥
Разрешены ослабленные импульсы
Множитель SL
Шире стоп-лосс 🛡️
Уже стоп-лосс 🎯
Соотношения TP
Более амбициозные цели 💰
Более консервативные цели
Отказ от ответственности ⚠️
Этот индикатор не исполняет сделки. Это аналитический инструмент 🧠. Уровни TP/SL — это рекомендации на основе волатильности, а не гарантии цены. Лучшие результаты достигаются в трендовых условиях 📈. Используйте в сочетании с анализом структуры рынка и правильным управлением рисками.
Сводка
Отзывы покупателей
5 | 100 % | |
4 | 0 % | |
3 | 0 % | |
2 | 0 % | |
1 | 0 % |