الوصف
نظرة عامة
تحليل انتشار الحجم (VSA) هو منهجية طورها توم ويليامز، تاجر سابق في النقابة، بناءً على عمل ريتشارد ويكوف من أوائل القرن العشرين. يفسر VSA العلاقة بين الحجم، انتشار السعر (النطاق)، وموقع الإغلاق لتحديد اختلالات العرض والطلب.
مفاهيم VSA الرئيسية:
- الحجم يظهر مقدار النشاط - من يشارك
- الانتشار يظهر التقلب وعدم اليقين - مدى تحرك السعر
- موقع الإغلاق يظهر من فاز بالشريط - المشترين أم البائعين
- السياق يظهر مكاننا في دورة السوق - مرحلة القوة أو الضعف
عندما يزيد الحجم مع انتشار واسع ولكن تقدم سعر قليل، فهذا يشير إلى الامتصاص (جانب واحد يمتص ضغط الجانب الآخر). عندما ينخفض الحجم مع انتشار ضيق في اتجاه، فهذا يشير إلى نقص المشاركة (ضعف محتمل).
هذا التنفيذ:
يقوم هذا المؤشر بقياس مفاهيم VSA باستخدام طرق إحصائية. يختلف عن VSA التقليدي بعدة طرق:
- يستخدم
(close - open) / rangeكمقياس للكفاءة (غير موجود في VSA الأصلي) - تحدد أنماط الامتصاص "فوز جانب واحد" بدلاً من "امتصاص الضغط" التقليدي
- يتم قياس ENR (الجهد بدون نتيجة) باستخدام عتبة الكفاءة؛ VSA الأصلي أكثر تفسيرًا
- يستخدم المتوسط المقتطع لمتوسط الحجم (مقاوم للقيم الشاذة) وترتيب النسبة المئوية للانتشار
- لا يشمل: حجم التوقف، الارتفاع المفاجئ، الاختبار، أنماط الهز
هذا نهج كمي وخوارزمي لمفاهيم VSA. VSA التقليدي أكثر تفسيرًا ويعتمد على السياق. استخدم هذا المؤشر كأداة تحليلية واحدة من بين العديد، وليس كإشارات مستقلة.
ما يفعله هذا المؤشر
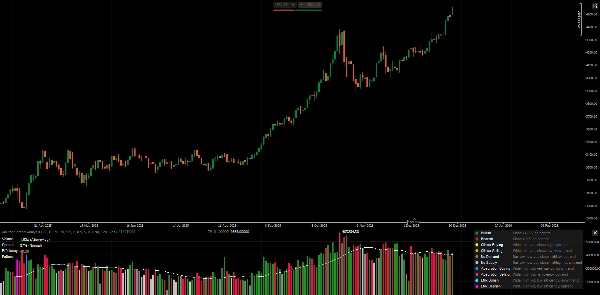
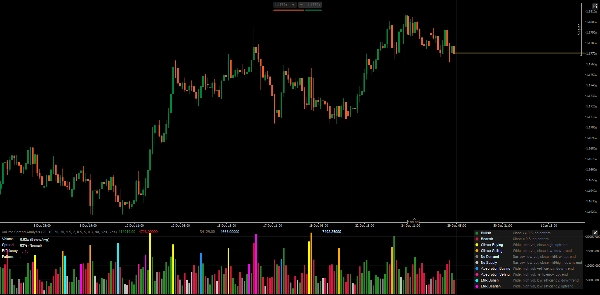
يحلل حجم كل شريط، والانتشار، وموقع الإغلاق لاكتشاف اختلالات محتملة في العرض/الطلب. يعرض مخطط هيستوجرام الحجم ملونًا حسب نوع النمط، مع لوحة مقاييس في الوقت الحقيقي.
تعريفات الأنماط
1. الأشرطة القياسية (بدون نمط)
- صعودي: الإغلاق ≥ 0.5 في النطاق، لم يتم اكتشاف نمط خاص
- هبوطي: الإغلاق < 0.5 في النطاق، لم يتم اكتشاف نمط خاص
2. أنماط الذروة (استنفاد محتمل)
- شراء الذروة: انتشار واسع + حجم فائق الارتفاع + إغلاق مرتفع + في اتجاه صاعد
-
- تفسير: احتمال استنفاد الشراء، راقب الانعكاس
- بيع الذروة: انتشار واسع + حجم فائق الارتفاع + إغلاق منخفض + في اتجاه هابط
-
- تفسير: احتمال استنفاد البيع، راقب الانعكاس
3. الأنماط الضعيفة (نقص الاقتناع)
- لا طلب: انتشار ضيق + حجم منخفض + إغلاق متوسط/منخفض + في اتجاه صاعد
-
- تفسير: المشترين لا يدعمون الارتفاع، ضعف محتمل
- لا عرض: انتشار ضيق + حجم منخفض + إغلاق متوسط/مرتفع + في اتجاه هابط
-
- تفسير: البائعين لا يدفعون السعر للأسفل، قوة محتملة
4. أنماط الامتصاص (فوز جانب واحد)
- امتصاص الشراء: انتشار واسع + حجم مرتفع + كفاءة إيجابية + في اتجاه هابط
-
- تفسير: المشترين يمتصون ضغط البيع، احتمال انعكاس صعودي
- امتصاص البيع: انتشار واسع + حجم مرتفع + كفاءة سلبية + في اتجاه صاعد
-
- تفسير: البائعين يمتصون ضغط الشراء، احتمال انعكاس هبوطي
5. أنماط ENR (جهد بدون نتيجة واضحة)
- ENR صعودي: انتشار واسع + حجم مرتفع + كفاءة منخفضة + في اتجاه هابط
-
- تفسير: جهد عالي لكن لا يوجد فائز واضح، دعم محتمل/تردد
- ENR هبوطي: انتشار واسع + حجم مرتفع + كفاءة منخفضة + في اتجاه صاعد
-
- تفسير: جهد عالي لكن لا يوجد فائز واضح، مقاومة محتملة/تردد
شرح لوحة المقاييس
الحجم
- يعرض حجم الشريط الحالي كنسبة إلى المتوسط المقتطع (مثلاً، "1.85x")
- التصنيف: منخفض / أقل من المتوسط / أعلى من المتوسط / مرتفع / مرتفع جدًا
- الحجم العالي = مشاركة السوق، لكن السياق مهم
الانتشار
- يعرض ترتيب النسبة المئوية (0-100%) بالنسبة للأشرطة الأخيرة
- التصنيف: ضيق / عادي / واسع
- الانتشار الواسع = تقلب/عدم يقين، وليس بالضرورة اتجاه
الكفاءة
- الصيغة:
(close - open) / (high - low) - النطاق: -1.0 إلى +1.0
- إيجابي = جسم صعودي يهيمن على النطاق
- سلبي = جسم هبوطي يهيمن على النطاق
- قريب من الصفر = جسم صغير، فتيل عالي، تردد
النمط
- النمط المكتشف الحالي (أو "-" إذا لم يوجد)
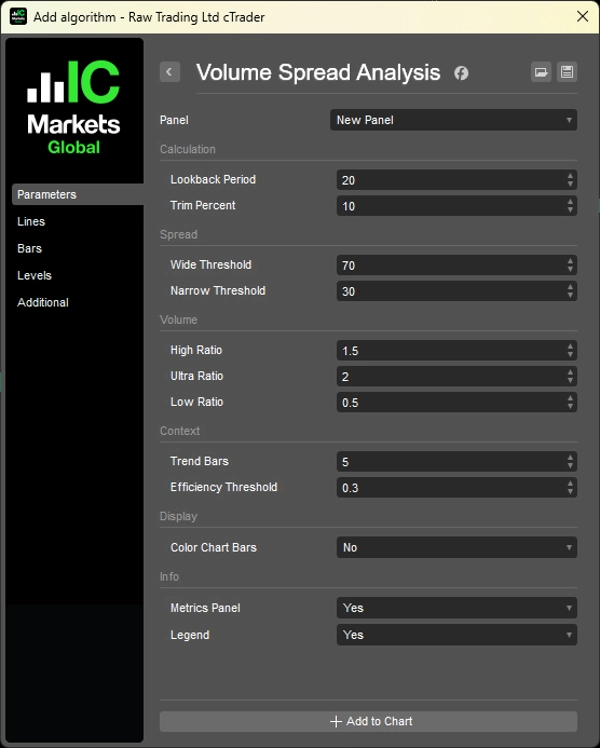
المعلمات
1. الحساب
- فترة الرجوع (20): الأشرطة المستخدمة لإحصائيات الحجم/الانتشار
- نسبة القص (10%): إزالة القيم الشاذة من حساب الحجم
2. تصنيف الانتشار
- عتبة الاتساع (70%): النسبة المئوية لتصنيف "واسع"
- عتبة الضيق (30%): النسبة المئوية لتصنيف "ضيق"
3. تصنيف الحجم
- نسبة عالية (1.5x): عتبة فوق المتوسط
- نسبة فائقة (2.0x): عتبة مرتفعة جدًا
- نسبة منخفضة (0.5x): عتبة تحت المتوسط
4. السياق
- أشرطة الاتجاه (5): الأشرطة السابقة للمقارنة لاتجاه الاتجاه
- عتبة الكفاءة (0.3): الحد الأدنى لـ "الكفاءة القوية"
5. العرض
- تلوين أشرطة المخطط: تطبيق ألوان الأنماط على مخطط السعر
- لوحة المقاييس: عرض المقاييس في الوقت الحقيقي
- الأسطورة: عرض دليل مرجعي للأنماط
كيفية الاستخدام
1. لا تستخدم الأنماط كإشارات تداول مباشرة - فهي تشير إلى السياق المحتمل، وليس نقاط الدخول.
2. اجمعها مع هيكل السعر - يعمل VSA بشكل أفضل عند تأكيد ما يظهره هيكل السعر.
3. راقب السياق - نفس النمط يمكن أن يعني أشياء مختلفة عند الدعم مقابل المقاومة.
4. منظور الحجم مهم - امتصاص حجم مرتفع عند مستوى رئيسي > امتصاص شريط عشوائي.
قيود حجم الفوركس
سوق الفوركس الفوري يعرض حجم التيك (عدد تغيرات السعر)، وليس العقود المتداولة الفعلية. قد تكون الأنماط أقل موثوقية مقارنة بالعقود الآجلة/الأسهم التي تحتوي على بيانات حجم حقيقية.
الأسطورة (مرجع مدمج)
قم بتمكين معلمة "الأسطورة" لعرض أوصاف الأنماط مباشرة على المخطط.
__________________________________________________________________________________________
مزيد من المؤشرات المجانية
استكشف مجموعة واسعة من أدوات تحليل السوق — من الهيكل والحجم إلى الانحدار، التقلب، والأطر الزمنية المخصصة.
رمز المصدر متاح على مستودع GitHub.
جميعها مجانية للاستخدام. ولكن إذا رغبت في دعم القهوة، يمكنك التبرع هنا.
الدعم/المقاومة
الحجم
- محلل نشاط الحجم
- محلل كفاءة الحجم
- تحليلات ملف الحجم
- ملف الحجم - محدث
- تحليل انتشار الحجم
- VWAP (متوسط السعر المرجح بالحجم)
المتوسطات المتحركة
- قناة SSL
- المتوسط المتحرك المثبت
- المتوسط المتحرك بمقياس الانحراف
- منشط جان العالي والمنخفض
- خط الاتجاه اللحظي
- متوسط متحرك كوفمان التكيفي مع رؤية الاتجاه
- قناة المتوسط المتحرك
- مجموعة المتوسطات المتحركة
- متوسط قناة الاتجاه المتحرك
الأدوات المساعدة/المخصصة
مبني على الانحدار
التقلب
المذبذبات
__________________________________________________________________________________________
إخلاء المسؤولية
التداول ينطوي على مخاطر. هذا المؤشر مخصص للتحليل الفني فقط — دائماً طبق إدارة المخاطر المناسبة وتداول بمسؤولية.
التعليقات والتحسينات
إذا كانت لديك اقتراحات، طلبات ميزات، أو أفكار للتحسين، يرجى ترك تعليق في علامة التبويب النقاش. تساعد ملاحظاتك في تحسين المؤشر للجميع.
الملخص
This implementation quantifies VSA concepts using statistical methods, including an efficiency metric defined as (close - open) / range, trimmed mean volume averaging, and percentile ranking for spread. It identifies several bar patterns: Standard (bullish/bearish), Climax (buying/selling exhaustion), Weak (No Demand/No Supply), Absorption (one side winning), and ENR (Effort No Result), each indicating different market conditions.
The indicator displays a volume histogram colored by detected pattern type and provides a real-time metrics panel showing volume ratio, spread percentile, efficiency, and current pattern. Parameters allow customization of lookback periods, volume/spread thresholds, and display options such as coloring chart bars and showing a pattern legend.
VSA is applicable across markets including Forex, stocks, indices, commodities, and crypto. Note that Forex volume reflects tick volume, which may affect pattern reliability. The indicator is designed as an analytical tool to complement price structure analysis rather than as standalone trade signals.
تقييمات العملاء
5 | 100 % | |
4 | 0 % | |
3 | 0 % | |
2 | 0 % | |
1 | 0 % |