
HIO Mutil Currency CCI Scanner
インジケーター
バージョン 1.0、May 2026
Windows、Mac
4.5
レビュー: 2
説明
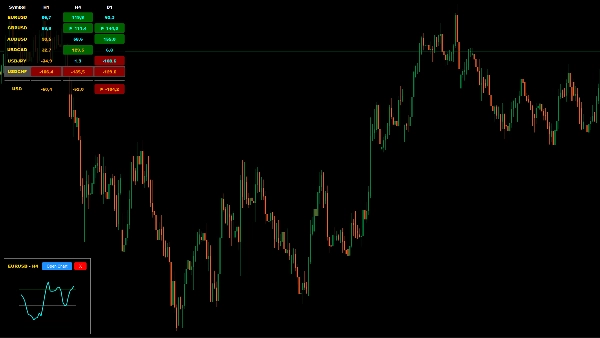
この HIOマルチ通貨CCIスキャナー は、トレーディングワークスペースを最適化するために設計されたカスタムcTraderインジケーターです。複数のチャートを行き来する代わりに、このインジケーターは複数のシンボルと時間枠のコモディティチャネル指数(CCI)値を同時に監視できる集中型ダッシュボードを提供します。単一のパネルから市場の極端な状態やトレンドの継続を特定するのに役立つように構築されています。
主な特徴
- マルチシンボル&時間枠マトリックス: cTraderチャート上の単一の統合パネルで、ユーザー定義のシンボルと時間枠を監視します。
- 通貨強度計算: ボリューム加重CCIアルゴリズムを使用してターゲット通貨の強度を推定する統合メーターを備えています。
- インタラクティブなミニチャート: ダッシュボード内の任意のデータセルをクリックすると、浮動ミニチャートが開き、メインワークスペースを離れることなく詳細なCCIラインを表示できます。
- 統合されたTelegramアラート: Telegramボットを接続して、個々の時間枠またはすべての時間枠の合流が事前定義された極端なゾーンに入るまたは出ると通知を受け取れます。
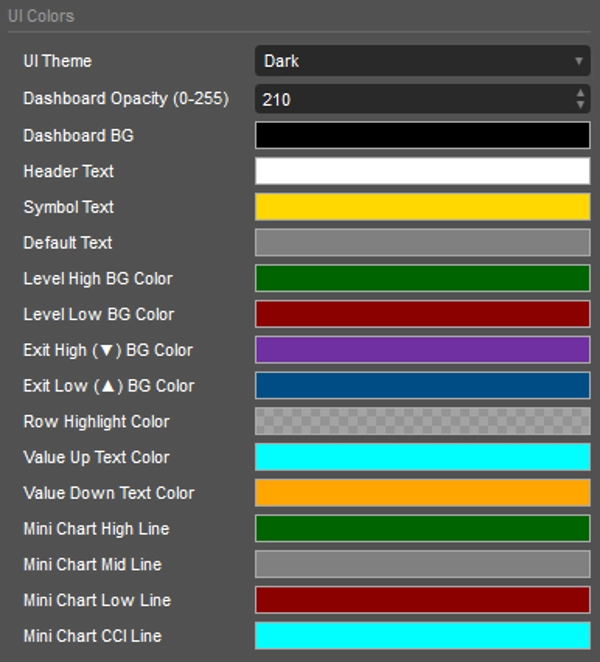
- カスタマイズ可能なUI: ライト、ダーク、またはカスタムカラーテーマで完全に適応可能なデザインにより、お好みのcTrader環境にシームレスに統合できます。
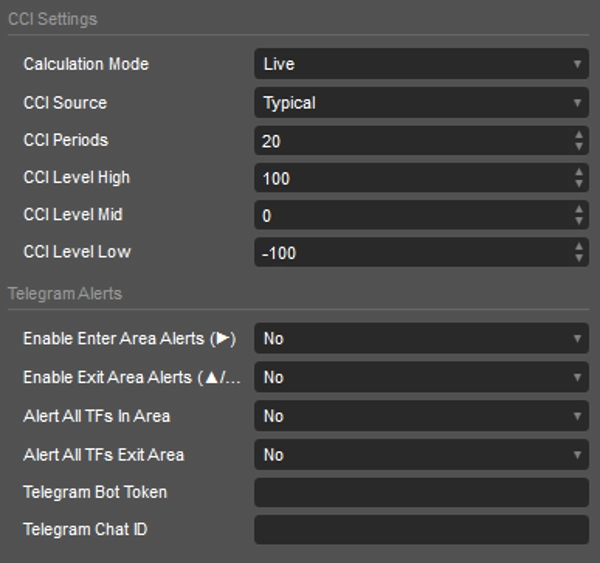
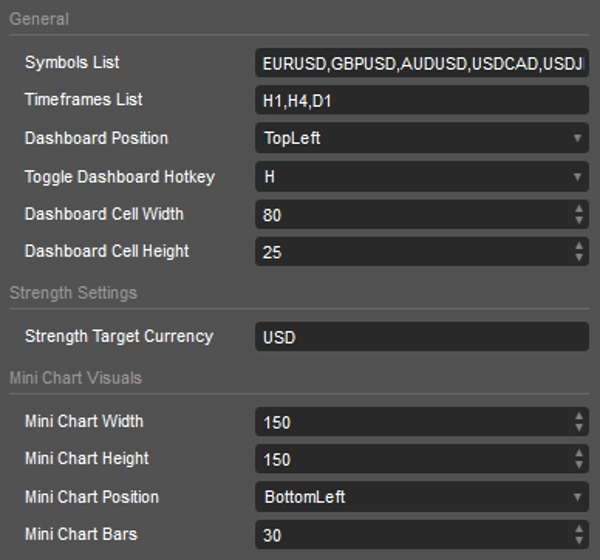
セットアップ&パラメーター
- シンボル&時間枠: カンマ区切りの値(例: EURUSD, GBPUSD および h1, h4, d1)を使用して、希望の資産と時間枠を入力します。
- ターゲット通貨: 強度メーター計算のための基軸通貨(例: USD)を定義します。
- CCI設定: 計算モード(ライブ/バークローズ)、データソース(例:クローズ、高値、安値)、期間、および特定の買われ過ぎ/売られ過ぎの閾値などのコアパラメーターをカスタマイズします。
- アラート設定: TelegramボットのトークンとチャットIDを入力して、リモートプッシュ通知を有効にします。
ダッシュボード凡例(色&シンボル)
ダッシュボードはモメンタムデータを迅速に伝えるために視覚的な手がかりを使用します:
- ダークグリーンの背景: CCIは現在買われ過ぎゾーンにあります。
- ダークレッドの背景: CCIは現在売られ過ぎゾーンにあります。
- 紫/青の背景: CCIは極端なゾーンから積極的に戻りつつあります。
- ▶ (エントリー): モメンタムが積極的に極端な閾値に入っています。
- ▼ (ダウン/エグジット): 買われ過ぎエリアから退出し、潜在的な下方向のモメンタムを示しています。
- ▲ (アップ/エグジット): 売られ過ぎエリアから退出し、潜在的な上方向のモメンタムを示しています。
注:このツールは、cTrader内でのテクニカル分析ワークフローを支援するための分析目的で設計されています。
概要
インジケーターのプロフィール
インジケーターのカテゴリー
モメンタム
出力の種類
ビジュアル表示
シグナル
フィルター
データ要件
バーのみ
ティックデータ
取引高
サポート対象のシグナル
クロス
ダイバージェンス
トレンドの強さ
ボラティリティ
ラインタッチ
ラインブレイク
反転
カスタマーレビュー
4.5
レビュー: 2
5 | 50 % | |
4 | 50 % | |
3 | 0 % | |
2 | 0 % | |
1 | 0 % |
ディスカッション
よくあるご質問
Volume
CCI
cTrader Storeで入手可能な取引ボット、インジケーター、プラグインなどの商品は、第三者の開発者が提供するものであり、情報と技術の取得のみを目的としてご利用いただけます。cTrader Storeはブローカーではなく、投資助言や個人的な推奨を行うことも、将来のパフォーマンスを保証することもありません。
この作成者の他の商品


価格
登録日 12/06/2025
1
販売
317
無料インストール