
(ViPi) MTF Candles
Indikator
106 muat turun
Versi 1.0, Feb 2026
Windows, Mac
Penerangan
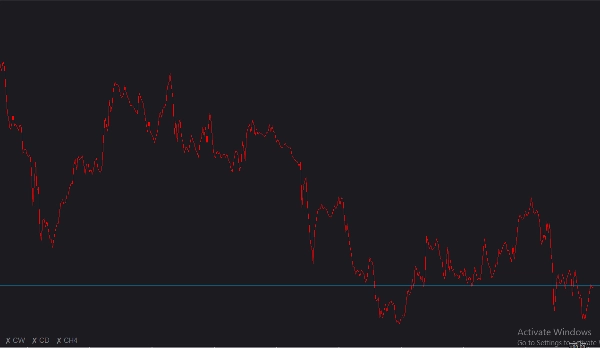
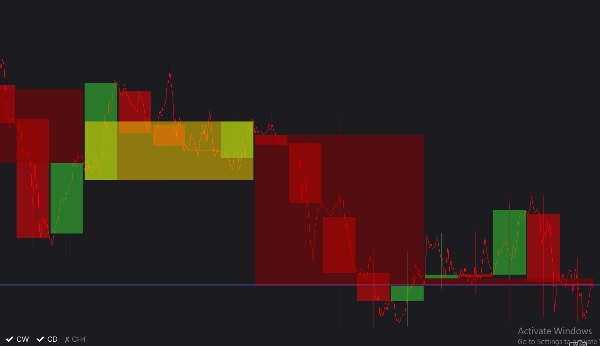
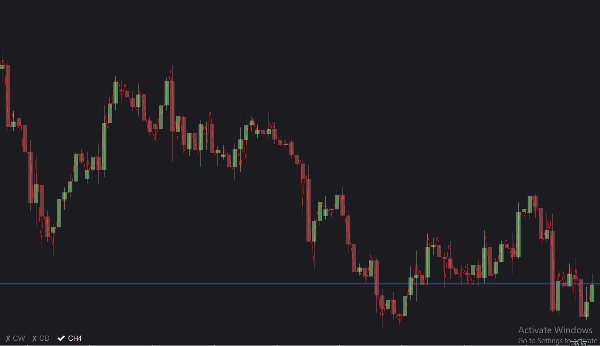
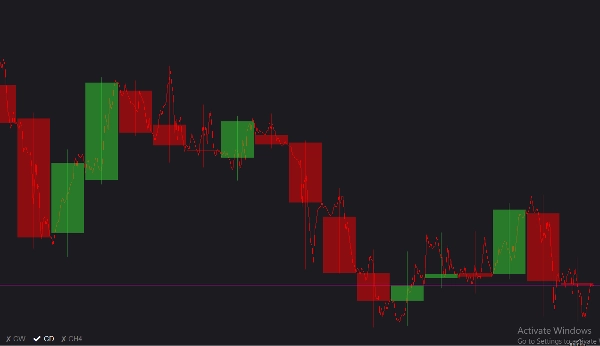
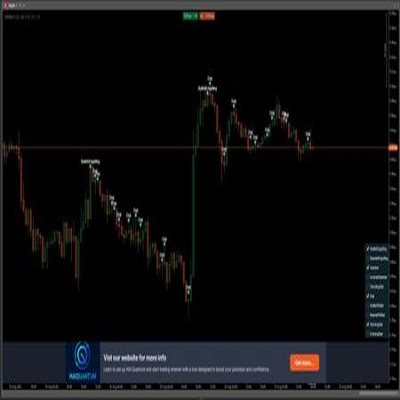
Pengenalan Terperinci (ViPi) MTF Candles adalah alat carta yang sangat interaktif dan boleh disesuaikan yang direka untuk memberikan pedagang perspektif pasaran dari atas ke bawah tanpa perlu meninggalkan carta aktif mereka. Dengan melapiskan sehingga tiga lilin jangka masa lebih tinggi (MTF) yang berbeza terus pada pandangan semasa anda, anda boleh dengan mudah mengenal pasti trend makroekonomi, tahap sokongan/rintangan utama, dan perubahan pasaran dengan sekilas pandang. Ia menampilkan menu togol pada carta yang kemas dan tidak mengganggu yang membolehkan anda segera menyembunyikan atau mendedahkan setiap jangka masa, memastikan ruang kerja anda kekal bersih dan fokus.
Senarai Parameter Penuh
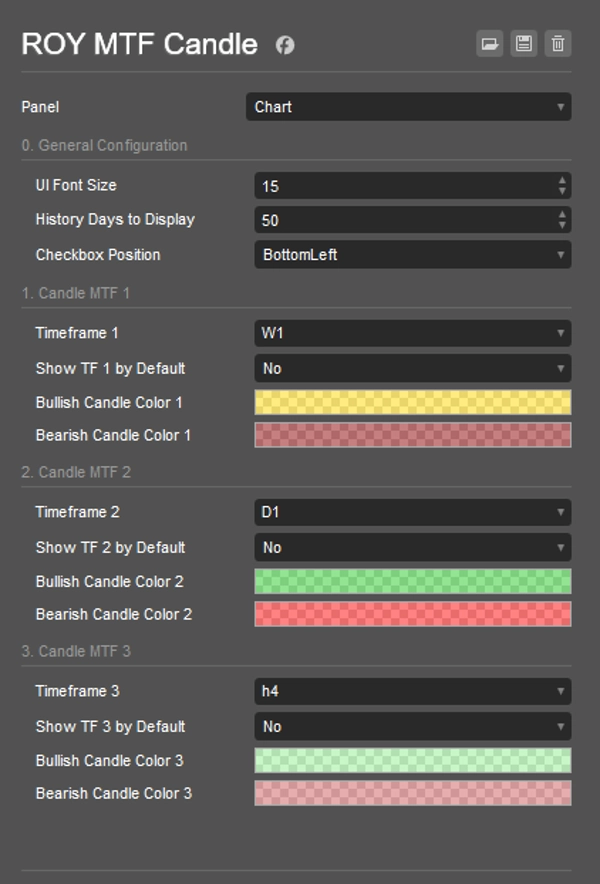
- Saiz Fon UI: Melaraskan saiz teks untuk butang togol interaktif pada carta. Boleh ditetapkan antara 8 dan 30 (Default: 11).
- Hari Sejarah untuk Dipaparkan: Menentukan berapa hari ke belakang penunjuk akan melukis lilin MTF sejarah (Default: 50 hari).
- Posisi Kotak Semak: Membolehkan anda meletakkan menu togol UI ke mana-mana sudut carta anda: TopLeft, TopRight, BottomLeft, atau BottomRight (Default: BottomLeft).
- Jangka Masa 1, 2, 3: Jangka masa lebih tinggi tertentu yang anda ingin pantau. (Default adalah Mingguan, Harian, dan Hour4 masing-masing).
- Paparkan TF 1, 2, 3 secara Lalai: Togol sama ada lilin setiap jangka masa kelihatan serta-merta apabila penunjuk digunakan pada carta (Default: False).
- Warna Lilin Bullish/Bearish: Membolehkan penyesuaian penuh warna lilin naik dan turun untuk setiap tiga jangka masa, lengkap dengan sokongan ketelusan untuk mengelakkan mengaburkan carta utama anda.
Panduan Penggunaan
- Pasang pada Carta: Muatkan penunjuk (ViPi) MTF Candles ke ruang kerja cTrader aktif anda.
- Konfigurasikan Jangka Masa: Buka tetapan dan pilih sehingga tiga jangka masa makro (contohnya, Mingguan, Harian, dan H4) yang anda ingin pantau bersama jangka masa semasa anda.
- Sesuaikan Visual: Laraskan warna dan ketelusan untuk lilin bullish dan bearish setiap jangka masa supaya ia kontras dengan latar belakang anda.
- Togol Kebolehlihatan dengan Cepat: Gunakan butang interaktif pada carta yang mudah (terletak di Posisi Kotak Semak yang anda pilih) untuk dengan cepat klik dan togol lapisan MTF tertentu hidup atau mati semasa anda melakukan analisis.
Ringkasan
Ringkasan AI
(ViPi) MTF Candles is a charting indicator for cTrader that overlays up to three higher timeframe (multi-timeframe, MTF) candlestick charts directly onto the current chart. This tool enables traders to analyze broader market trends, key support and resistance levels, and shifts in market sentiment without switching charts. Users can customize the displayed timeframes—commonly Weekly, Daily, and 4-hour—and adjust the number of historical days shown. The indicator includes an on-chart toggle menu, which can be positioned in any corner of the chart, allowing quick visibility control of each timeframe overlay. Visual customization options include adjustable font sizes for toggle buttons and configurable bullish/bearish candle colors with transparency settings to maintain chart clarity. This facilitates a streamlined, interactive top-down market perspective suitable for various markets including Forex, indices, commodities, stocks, and cryptocurrencies.
Profil indikator
Ulasan pelanggan
0.0
Ulasan: 0
Ulasan pelanggan
Belum ada ulasan untuk produk ini. Anda sudah mencuba produk tersebut? Jadilah yang pertama untuk berkongsi pendapat anda!
Perbincangan
Soalan Lazim
BTCUSD
Forex
Indices
EURUSD
Commodities
GBPUSD
NZDUSD
Crypto
Stocks
XAUUSD
NAS100
USDJPY
Produk yang tersedia melalui cTrader Store, termasuk bot dagangan, indikator dan plugin, disediakan oleh pembangun pihak ketiga dan diberikan akses untuk tujuan maklumat dan teknikal sahaja. cTrader Store bukan broker dan tidak memberikan nasihat pelaburan, syor peribadi atau sebarang jaminan prestasi masa hadapan.
Lebih banyak produk daripada penulis ini


Harga
Sejak 12/06/2025
1
Jualan
336
Pemasangan percuma