
الوصف
يقوم مؤشر cTrader هذا بتحديد وتصور الأول من اختلالات السوق المحددة التي تحدث خلال الجلسات الثلاث الرئيسية لتداول نيويورك. تم تصميمه لممارسي ICT (Inner Circle Trader) الذين يركزون على الإعدادات "المقدمة أولاً" كآثار مؤسسية ذات احتمالية عالية.
الوظائف الأساسية (Core)
يراقب المؤشر السوق بدءًا من افتتاح كل جلسة و"يقفل" أول اختلال يجده. بمجرد رسم نوع من الاختلال (مثل FVG) لجلسة معينة، لن يرسم نوعًا آخر من نفس النوع حتى تبدأ الجلسة التالية.
1. أنواع الاختلال المكتشفة
- فجوة القيمة العادلة (FVG): هيكل مكون من ثلاث شموع حيث لا تتداخل فتيل الشمعة الأولى مع فتيل الشمعة الثالثة، مما يترك "فجوة" في نطاق سعر الشمعة الثانية.
- اختلال الحجم (VI): يحدث عندما يكون هناك فجوة بين أجسام (الفتح/الإغلاق) لشمعتين متتاليتين، حتى لو تداخلت الفتيول.
- فراغ السيولة (LV): فجوة أكثر حدة حيث لا يوجد أي حركة سعرية على الإطلاق بين فتيلين لشمعتين متتاليتين (قفزة كاملة في السعر).
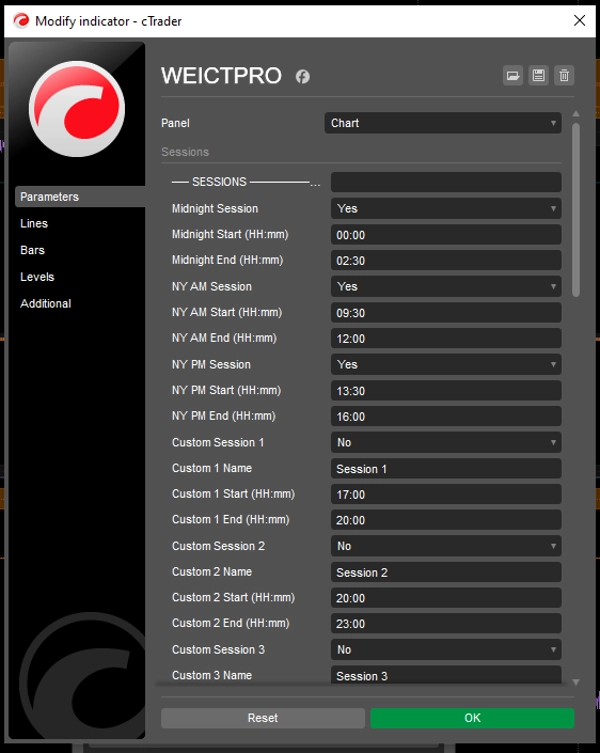
2. الجلسات المراقبة (بتوقيت نيويورك)
يقوم المؤشر تلقائيًا بتحويل وقت الرسم البياني الخاص بك إلى التوقيت الشرقي (ET) لتتبع:
- منتصف الليل: 00:00 – 02:30
- صباح نيويورك: 09:30 – 12:00
- مساء نيويورك: 13:30 – 16:00
الميزات البصرية
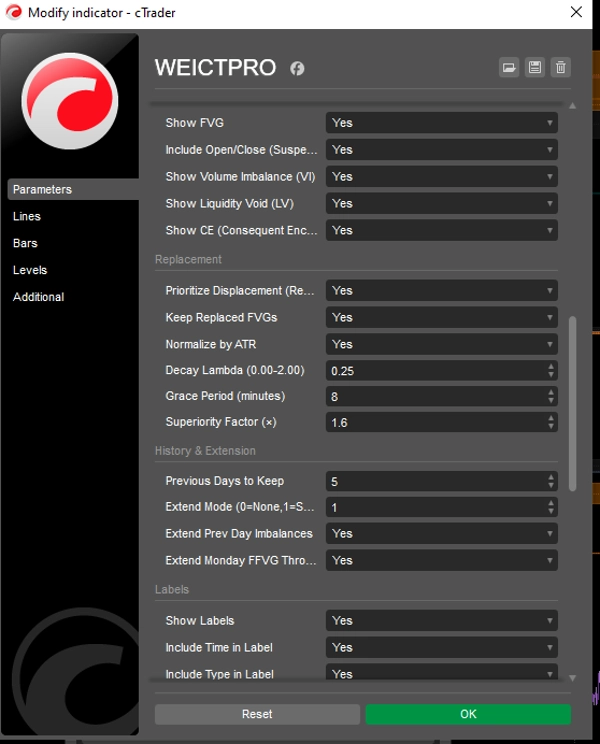
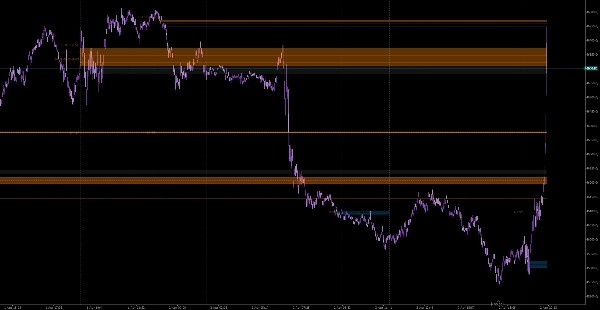
- التمديد الديناميكي: يتم رسم الصناديق من نقطة الأصل وتمتد تلقائيًا إلى الأمام بعدد من الأعمدة يحدده المستخدم (
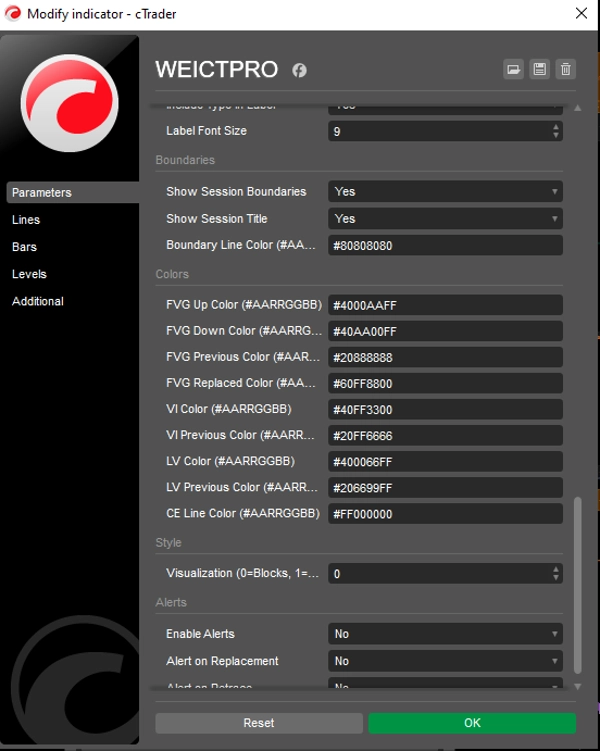
Extend Bars) لعرض الدعم/المقاومة المحتملة في المستقبل. - التعدي اللاحق (CE): يرسم خطًا متقطعًا في منتصف الاختلال. في نظرية ICT، مستوى 50% (CE) هو نقطة مرجعية مؤسسية حاسمة.
- التسمية التلقائية: يحدد بوضوح كل صندوق باسم الجلسة ونوع الاختلال (مثل "صباح نيويورك +FVG").
المعلمات الرئيسية
المعلمة
الوصف
عرض FVG/VI/LV
تبديل أنواع الاختلال المحددة التي تريد تتبعها.
عتامة الصندوق
يضبط مدى "صلابة" المناطق المظللة التي تظهر على الرسم البياني الخاص بك.
تمديد الأعمدة
عدد الشموع التي يجب أن يمتد إليها الصندوق في المستقبل.
المنطقة الزمنية
مشفرة بشكل ثابت إلى التوقيت الشرقي القياسي لضمان دقة الجلسة بغض النظر عن وقت خادم الوسيط الخاص بك.
التوصيات الفنية
- الأطر الزمنية: يُفضل استخدامها على M1 إلى M15. في الأطر الزمنية الأعلى (H1+)، تكون الجلسات قصيرة جدًا لالتقاط الاختلال "الأول" بشكل موثوق.
- الاستخدام: غالبًا ما تعمل هذه المناطق كـ "مغناطيس" للسعر. يبحث المتداولون عن عودة السعر إلى هذه الصناديق (وخاصة مستوى CE) للدخول قبل الاستمرار في الاتجاه الأصلي.
الملخص
The indicator detects three imbalance types: Fair Value Gap (FVG), a three-candle gap where the first and third candle wicks do not overlap; Volume Imbalance (VI), a gap between the bodies of two consecutive candles; and Liquidity Void (LV), a total price jump with no price action between consecutive candle wicks. Once an imbalance type is identified in a session, it locks and does not redraw until the next session.
Visual features include dynamically extending boxes from the imbalance origin for a user-defined number of bars, a dashed midline marking the 50% level (Consequent Encroachment), and automated labeling with session and imbalance type. The indicator is hardcoded to Eastern Time for session accuracy and is best used on M1 to M15 timeframes to reliably capture the first imbalance. Users can toggle imbalance types, adjust box opacity, and set extension length. This tool supports multiple markets including Forex, indices, commodities, stocks, and cryptocurrencies.


