الوصف
ما هو Quantum Flow؟
Quantum Flow هو مؤشر تراكب دقيق لـ cTrader يقيس مكان وجود السعر الحالي ضمن نطاقه التاريخي — معبرًا عنه كرتبة مئوية من 0 إلى 100. على عكس المذبذبات التقليدية مثل RSI أو Stochastic، لا يعتمد Quantum Flow على عتبات تشبع شراء/تشبع بيع ثابتة. بدلاً من ذلك، يتكيف ديناميكيًا مع نطاق السعر الفعلي لفترة النظر المختارة، مما يمنحك صورة أكثر دقة ووعيًا بالسياق لقوة السوق.
النتيجة هي نظام إشارة نظيف وقابل للتنفيذ يخبرك ليس فقط بما يفعله السعر، بل مدى تطرف تلك الحركة مقارنة بالتاريخ الحديث — وما إذا كان لديه دعم متعدد الأطر الزمنية ليكون موثوقًا به.
────────────────────────
مؤشرات مميزة أخرى متاحة في متجر cTrader:
- Quantum Flow – محرك زخم رتبة مئوية متكيف مع تأكيد MTF https://ctrader.com/products/4330
- SmartArrows AI V2 – مؤشر إشارة لرسوم Renko مع تحليل MTF https://ctrader.com/products/1797
- VoltyPulse – نظام إشارة فني متعدد الأوضاع مع 3 طبقات فلتر مستقلة https://ctrader.com/products/4233
- TDI Signal Pro – محرك TDI متقدم مع إشارات Shark Fin وExtreme Cross وDivergence https://ctrader.com/products/4343
- PipMiner – مؤشر تحقق من الزخم والاتجاه بدقة معتمد على MACD https://ctrader.com/products/4242
- Elliot Wave Impulse Pro – اكتشاف موجة Elliott تلقائي مع فلاتر احترافية https://ctrader.com/products/3221
────────────────────────
الميزات الرئيسية
> محرك رتبة مئوية
يتكيف مع أي سوق وأي إطار زمني. لا توجد مستويات ثابتة — يقوم المؤشر بمعايرة نفسه وفقًا لحركة السعر الفعلية في نافذة النظر الخاصة بك. يعمل على الفوركس، المؤشرات، السلع، العملات المشفرة، والأسهم.
> تلوين شريط ديناميكي
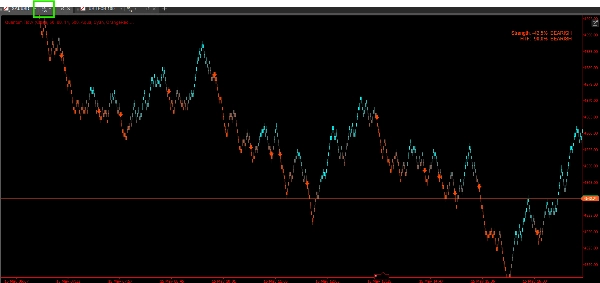
يتم تلوين كل شريط بتدرج سلس يعكس شدة الرتبة الحالية. ينتقل الزخم الصعودي من الرمادي إلى لون الصعود الخاص بك (الافتراضي: السيان)، والهبوطي من الرمادي إلى لون الهبوط الخاص بك (الافتراضي: أورانج ريد). بنظرة سريعة، يمكنك قراءة تاريخ الزخم الكامل للرسم البياني دون دراسة لوحة مذبذب منفصلة.
> أسهم الإشارة مع وضع قائم على ATR
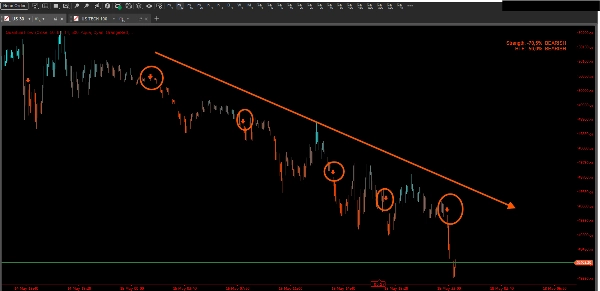
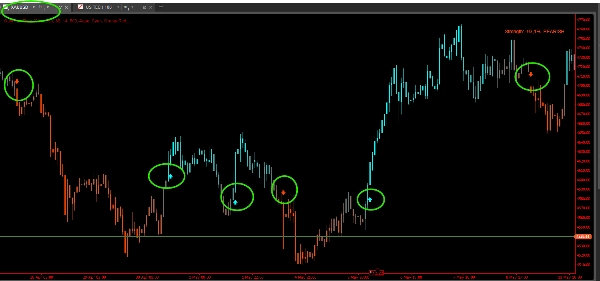
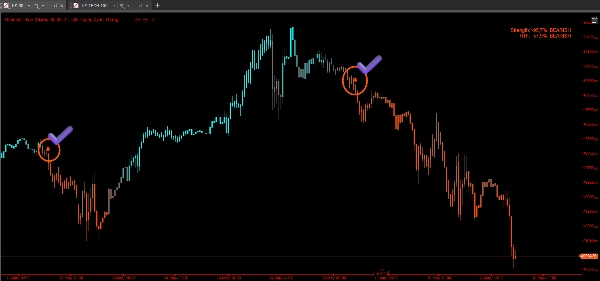
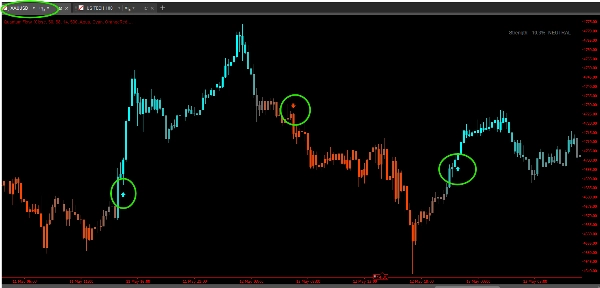
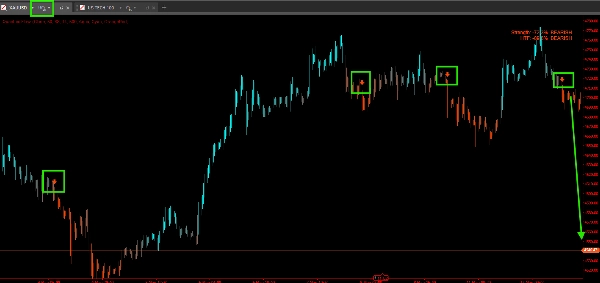
عندما تتجاوز الرتبة عتبة الإشارة (الافتراضي: 88 للصعود، 12 للهبوط)، يرسم Quantum Flow سهمًا فوق أو تحت الشريط. يتم حساب إزاحة السهم باستخدام ATR الحالي بحيث لا يزدحم الشموع — يتغير تلقائيًا مع التقلب.
تطلق الإشارات مرة واحدة فقط لكل اتجاه اتجاهي — لا يوجد تكرار دخول. بمجرد تفعيل إشارة صعود، لا يتم رسم أسهم صعود إضافية حتى يعكس السوق ويتأهل مرة أخرى.
> تأكيد متعدد الأطر الزمنية (MTF)
واحدة من أقوى ميزات Quantum Flow. قم بتمكين وضع MTF واختر إطارًا زمنيًا أعلى (مثلاً، H1 عند التداول على M15). سيعرض Quantum Flow إشارة صعود فقط على الرسم البياني الحالي إذا أكد إطار الزمن الأعلى أيضًا الانحياز الصعودي — والعكس صحيح لإشارات الهبوط.
يقلل هذا الفلتر الواحد بشكل كبير من ضوضاء الاتجاه المعاكس ويحافظ على توافقك مع تدفق السوق السائد.
> تنبيهات إغلاق الشريط
تطلق التنبيهات بعد إغلاق الشريط — وليس على تقلب داخل الشريط. هذا يعني أن كل تنبيه تتلقاه يتوافق مع شريط إشارة مؤكد ومغلق. لا مزيد من التنبيهات الخاطئة من الفتائل أو الارتفاعات المؤقتة. يدعم التنبيهات المنبثقة وإشعارات الصوت.
> لوحة القوة في الوقت الحقيقي
لوحة مدمجة، مرئية دائمًا (موقع قابل للتكوين: أعلى اليسار، أعلى اليمين، أسفل اليسار، أسفل اليمين) تعرض:
- نسبة القوة % للشريط الحالي معبرًا عنها كانحراف عن الحياد (مثلاً، +76% صعودي)
- نسبة قوة HTF % عند تمكين وضع MTF
- تسمية الانحياز بلغة بسيطة: صعودي / هبوطي / محايد
> 5 إعدادات ألوان مسبقة + ألوان مخصصة
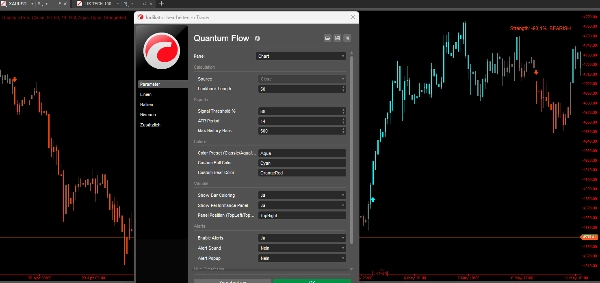
اختر من الكلاسيكي (أخضر/أحمر)، أكوا (سيان/برتقالي — الافتراضي)، كوزميك (أزرق مخضر/بنفسجي)، سايبر (سيان/برتقالي داكن)، أو نيون (أصفر/ماجنتا). أو حدد ألوانك الخاصة الدقيقة باستخدام أي اسم لون مدعوم من cTrader.
> تحكم في نافذة التاريخ
حدد بالضبط عدد الأشرطة التاريخية التي تتلقى التلوين وأسهم الإشارة (الافتراضي: 500، الحد الأقصى: 5000). مفيد للحفاظ على نظافة الرسم البياني دون تحميل تاريخ غير ضروري.
كيفية استخدام Quantum Flow
الخطوة 1 — التطبيق على الرسم البياني
أضف Quantum Flow إلى أي رسم بياني كطبقة تراكب. اختر المصدر المفضل لديك (الإغلاق افتراضيًا) واضبط طول فترة النظر ليتناسب مع أسلوب تداولك:
- سكالبينج / M1–M5: 20–30 شريطًا
- تداول يومي / M15–H1: 50 شريطًا (افتراضي)
- تأرجح / H4–يومي: 100–200 شريطًا
الخطوة 2 — قراءة ألوان الأشرطة
بمجرد التطبيق، سيعيد الرسم البياني تلوين الأشرطة بناءً على الرتبة الحية:
- لون صعودي ساطع = السعر قريب من أعلى نطاقه الأخير → الزخم قوي
- لون هبوطي ساطع = السعر قريب من القاع → ضغط البيع يهيمن
- رمادي / نغمة خافتة = السعر قريب من المنتصف → لا يوجد اتجاه واضح، تجنب التداول
الخطوة 3 — انتظر أسهم الإشارة
لا تتصرف بناءً على اللون فقط. انتظر السهم:
- سهم لأعلى تحت الشريط = وصلت الرتبة إلى عتبة الصعود → إعداد محتمل للشراء
- سهم لأسفل فوق الشريط = وصلت الرتبة إلى عتبة الهبوط → إعداد محتمل للبيع
ادمج مع نموذج الدخول الخاص بك — الدعم/المقاومة، أنماط الشموع، أو تدفق الأوامر. يحدد Quantum Flow سياق الزخم، وليس الزناد الدقيق للدخول.
الخطوة 4 — استخدم تأكيد MTF (موصى به)
قم بتمكين عرض تأكيد MTF واضبط الإطار الزمني الأعلى إلى 3–5 أضعاف إطار الرسم البياني الحالي. على سبيل المثال:
- التداول على M15 → ضبط HTF إلى H1
- التداول على H1 → ضبط HTF إلى H4 أو يومي
خذ إعدادات شراء فقط عندما يظهر كل من الإطار الزمني الحالي وHTF رتبة صعودية. يمكن لهذه القاعدة الوحيدة تحسين معدل الفوز بشكل كبير من خلال إبقائك على الجانب الصحيح من الاتجاه الأكبر.
الخطوة 5 — راقب لوحة القوة
استخدم اللوحة كمرجع سريع للانحياز الحالي دون التمرير في الرسم البياني. قراءة +60% صعودي أو أعلى على كلا الإطارين هي منطقة تلاقي قوية. قراءة قريبة من 0% محايد على أي من الإطارين تشير إلى الانتظار.
الخطوة 6 — ضبط التنبيهات
قم بتمكين التنبيهات لتتلقى إشعارات على إشارات إغلاق الشريط المؤكدة دون مراقبة الشاشة. تتضمن رسالة المنبثق الرمز، الإطار الزمني، واتجاه الإشارة بحيث يمكنك التداول عبر عدة رسوم بيانية في نفس الوقت.
لمن هذا؟
تم تصميم Quantum Flow للمتداولين الذين يريدون قراءة زخم نظيفة وموضوعية بدون ضوضاء المذبذبات التقليدية. يناسب:
- المتداولين اليوميين الذين يحتاجون إلى ردود بصرية سريعة وموثوقة على الزخم
- متداولي التأرجح الذين يريدون الدخول فقط عندما يتوافق الزخم متعدد الأطر الزمنية
- متتبعي الاتجاه الذين يريدون تجنب مقاومة الزخم السائد
- متداولي حركة السعر الذين يريدون طبقة سياق غير ذاتية مضافة إلى إعداداتهم الحالية
ما الذي يجعل Quantum Flow مختلفًا؟
معظم مؤشرات الزخم تقيس معدل التغير أو القوة النسبية مقابل صيغة ثابتة. بدلاً من ذلك، يطرح Quantum Flow سؤالًا أبسط وأكثر قوة: "هل هذا الشريط أقرب إلى قمة حديثة أم قاع حديث؟"
تعني هذه الطريقة القائمة على الرتبة المئوية:
- لا يوجد متوسط متحرك متأخر في جوهره
- لا توجد عتبات تشبع شراء/تشبع بيع ثابتة تفشل في الأسواق المتجهة
- تكيف كامل مع أي نظام تقلب
- تلوين الأشرطة يمنحك تاريخًا بصريًا مستمرًا — وليس مجرد مذبذب منفصل عليك ربطه ذهنيًا
مُدمجًا مع فلتر MTF وتنبيهات إغلاق الشريط، يمنحك Quantum Flow نظام زخم كامل ومستقل يعمل عبر جميع الأسواق والأطر الزمنية — جاهز للاستخدام فورًا.
الملخص
Key features include signal arrows triggered when the rank crosses customizable thresholds, with arrow placement scaled by the Average True Range (ATR) to avoid clutter. Signals occur only once per trend direction to prevent re-entry noise. A multi-timeframe (MTF) confirmation mode filters signals by requiring alignment with a higher timeframe's momentum, reducing counter-trend noise. Alerts fire only after bar close, ensuring confirmed signals.
A real-time strength panel displays current and higher timeframe momentum percentages and a plain-language bias label (Bullish, Bearish, Neutral). The indicator supports Forex, indices, commodities, cryptocurrencies, and stocks across all timeframes. Users can customize colors, history length, and alert settings. Quantum Flow is designed for intraday, swing, trend-following, and price action traders seeking an objective, adaptive momentum context overlay.
تقييمات العملاء
5 | 50 % | |
4 | 50 % | |
3 | 0 % | |
2 | 0 % | |
1 | 0 % |