Descripción
VERSIÓN ACTUALIZADA DEL PERFIL DE VOLUMEN
En comparación con la versión anterior, esta versión actualizada incluye correcciones críticas de errores, nuevas funciones y mejoras significativas en el rendimiento:
Correcciones
- Distribución de volumen corregida: asignación proporcional basada en la superposición de velas en lugar de 100% a todos los niveles tocados
- Detección de VAH/VAL corregida: la tolerancia escala con la altura del nivel en lugar de un valor codificado
- Posicionamiento de texto corregido: desplazamientos dinámicos basados en el marco temporal en lugar de días codificados
- Validación de DateTime corregida: comprobación de barras vacías, validación fuera de rango
Funciones
- Parámetro de compensación de zona horaria añadido para perfiles DateTime
- Parámetro de posición de texto añadido (Izquierda/Derecha) para modo retrospectivo
- Las etiquetas del modo DateTime ahora siguen los bordes de las barras (ancho variable) o se alinean en el borde del perfil (ancho completo)
Rendimiento
- Búsqueda binaria para la búsqueda de índice DateTime (antes era lineal O(n))
- Cálculo en caché del volumen total (antes se recalculaba por nivel)
- Diccionario TPO predimensionado para evitar redimensionamientos
- Patrón TryGetValue para búsquedas en diccionarios
- Bucles basados en índices reemplazando foreach en rutas críticas
Limpieza
- Parámetro ProfileWidth eliminado (el cálculo automático siempre es correcto)
- Intersección de velas simplificada a una sola condición
__________________________________________________________________________________________
NOTAS IMPORTANTES - LEA PRIMERO
El volumen en Forex no es volumen real
El volumen en forex es volumen de ticks: cuenta cuántas veces cambia el precio. NO cuenta cuánto dinero se negoció.
Lo que el volumen de ticks no puede mostrar
- Tamaño de la operación. Una operación de $100 y una de $10,000,000 cuentan ambas como 1 tick.
- Flujo real de dinero. No puedes ver si el precio fue movido por dinero grande o pequeño.
- Liquidez verdadera. No puedes ver cuántas órdenes están esperando en el mercado.
- Actividad bancaria. Los bancos ven datos de volumen real. Tú no.
Lo que esto significa
El volumen de ticks solo muestra cuántas veces cambió el precio, no el dinero detrás. Esto crea problemas:
- No puedes rastrear bancos o instituciones. Ellos usan datos de volumen real a los que no tienes acceso.
- No puedes probar teorías de "dinero inteligente". Esas ideas necesitan volumen real, no conteos de ticks.
- No puedes juzgar la liquidez verdadera. La actividad de ticks no muestra profundidad de órdenes ni fuerza real del mercado.
- No puedes medir el poder real de compra o venta. Muchas operaciones pequeñas parecen iguales a una gran operación institucional.
- Los picos de volumen pueden engañar. Un pico puede ser solo ruido algorítmico, no interés real de trading.
Cómo usar correctamente este indicador
- Trátalo como un medidor de actividad, no de dinero. Volumen alto de ticks = mercado activo. Volumen bajo de ticks = mercado tranquilo. Nada más.
- Compara la actividad entre diferentes momentos. Úsalo para ver: ¿La sesión de Londres está más activa que la de Nueva York? ¿Hoy es más activo que ayer? ¿El periodo de tendencia está más activo que la consolidación?
- Combínalo con la estructura del precio. Usa soporte/resistencia, puntos de giro o BOS/ChoCH junto con el volumen. El contexto del precio previene señales falsas de picos de volumen ruidosos.
- Observa la actividad en niveles de precio importantes. Cuando el precio prueba un nivel clave y el volumen de ticks aumenta, significa que más traders están activos. NO significa que jugadores grandes estén involucrados.
- No asumas que muestra actividad institucional. El volumen de ticks no puede mostrar acumulación, órdenes grandes o "dinero inteligente". Úsalo solo para medir ritmo y tempo.
__________________________________________________________________________________________
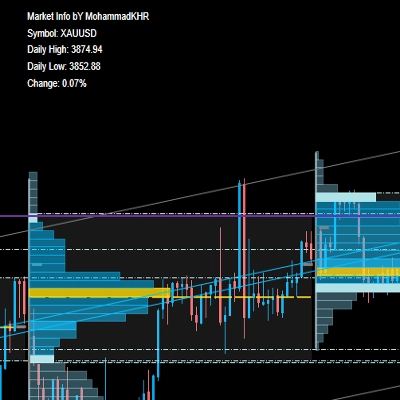
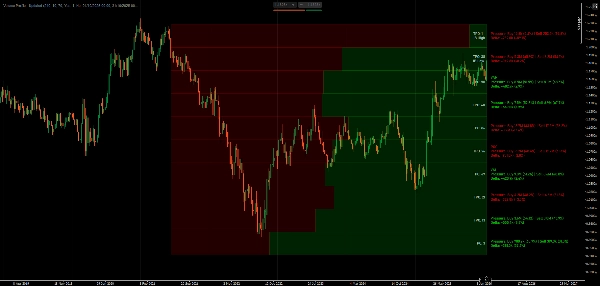
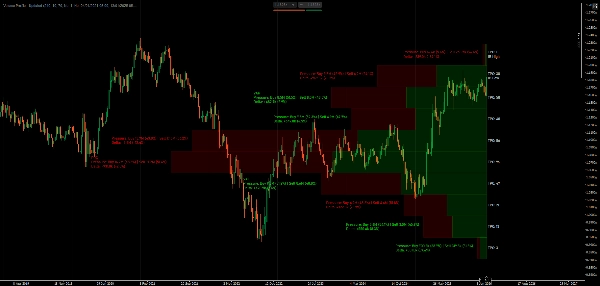
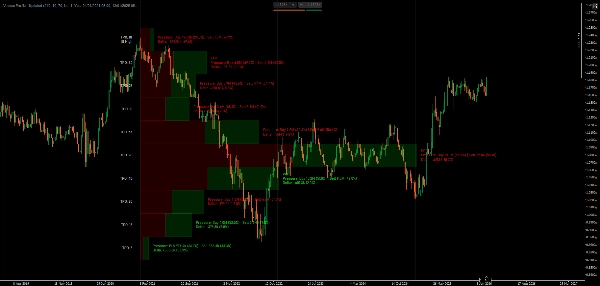
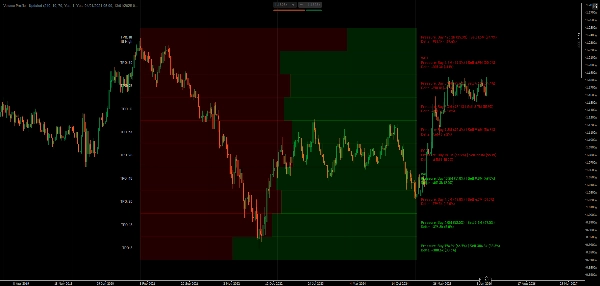
Visualiza la distribución de volumen y el tiempo pasado en el precio con seguimiento de POC, Área de Valor y TPO de Perfil de Mercado.
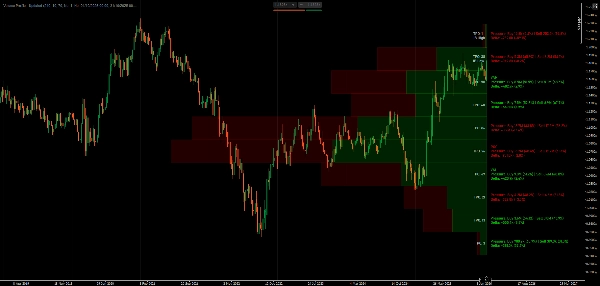
Este indicador muestra la distribución de volumen usando conceptos de Perfil de Mercado. Muestra el Punto de Control (nivel con mayor actividad de ticks), los límites del Área de Valor (donde ocurrió la mayor parte del trading), secuencias de letras TPO (tiempo pasado en cada precio) y visualización delta que divide la actividad de ticks según la dirección de la vela.
Puedes elegir periodos retrospectivos o establecer rangos de fechas específicos, mostrar barras de volumen como proporcionales o de ancho completo, alternar entre todos los niveles o solo niveles clave, y personalizar colores para actividad alcista/bajista.
FUNCIONES
Análisis de Distribución de Volumen
- Punto de Control (POC): Nivel de precio con mayor actividad—donde el precio pasó más tiempo
- Área de Valor (VA): Zona personalizable de concentración de actividad (por defecto 70%)—donde ocurrió la mayor parte del trading
- VAH/VAL: Límites Alto/Bajo del Área de Valor—niveles potenciales de soporte/resistencia
- Visualización Delta: Barras divididas muestran la dirección de la vela en cada nivel de precio
Perfil de Mercado TPO
- Seguimiento Time Price Opportunity: Cuenta cuántos periodos de tiempo se negociaron en cada precio
- Letras TPO: Representación visual del tiempo pasado en el precio (secuencia A-Z)
- Balance Inicial (IB): Rango de la primera hora—importante para la estructura del day trading
- Marcadores Alto/Bajo IB: Extremos del rango de apertura
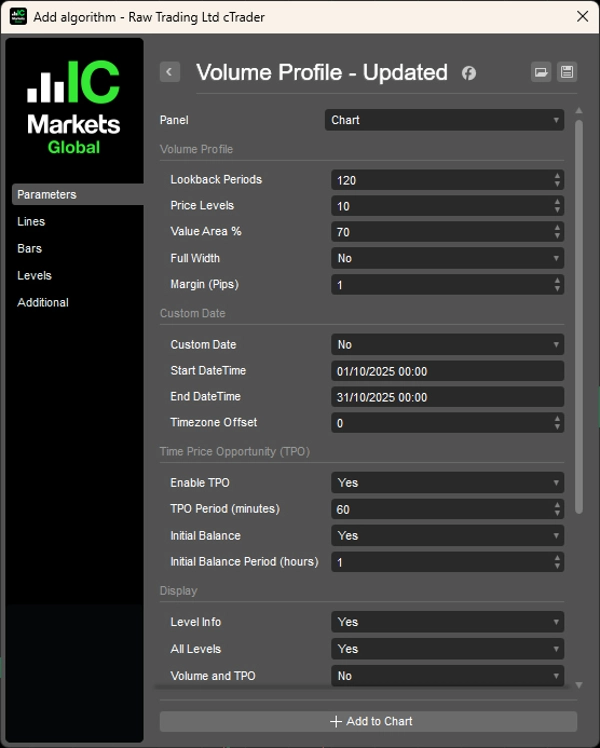
Opciones flexibles de retrospectiva
- Basado en periodo: Establece número de barras a analizar (ej., últimas 120 barras)
- Rango DateTime: Ancla el perfil entre fechas/horas específicas para análisis de eventos
- Ancho dinámico: Perfiles con escala automática o ancho fijo
Opciones de visualización
- Barras de volumen: Ancho proporcional (escalado por actividad) o barras uniformes de ancho completo
- División de dirección de vela dentro de cada barra
- Cálculos delta con porcentajes
- Alternar todos los niveles o solo niveles clave (POC, VAH, VAL)
- Control de visibilidad de detalles de Volumen/TPO
- Desglose direccional con porcentajes
- Tamaño de fuente ajustable y márgenes basados en pips
Personalización de colores
- Colores independientes para barras de dirección alcista/bajista
- Colores de texto separados para delta positivo/negativo
- Color de texto específico para TPO
Optimizado para rendimiento
- Búsquedas de tiempo en caché y dibujo eficiente de rectángulos
- Recalculación mínima para un rendimiento fluido
- Cálculo delta de nivel profesional basado en la estructura de la vela
__________________________________________________________________________________________
MÁS INDICADORES GRATUITOS
Explora una amplia gama de herramientas de análisis de mercado—desde estructura y volumen hasta regresión, volatilidad y marcos temporales personalizados.
El código fuente está disponible en el repositorio de GitHub.
Todos son gratuitos para usar. Pero si quieres apoyar con un café, puedes hacerlo aquí.
Soporte/Resistencia
Volumen
- Perfilador de Actividad de Volumen
- Analizador de Eficiencia de Volumen
- Análisis de Perfil de Volumen
- Perfil de Volumen - Actualizado
- Análisis de Spread de Volumen
- VWAP (Precio Promedio Ponderado por Volumen)
Medias Móviles
- Canal SSL
- Media Móvil Anclada
- Media Móvil Escalada por Desviación
- Activador Gann High Low
- Línea de Tendencia Instantánea
- Media Móvil Adaptativa Kaufman con Visión de Tendencia
- Canal de Media Móvil
- Suite de Medias Móviles
- Media Móvil de Canal de Tendencia
Utilidades/Personalizados
Basado en Regresión
Volatilidad
Osciladores
__________________________________________________________________________________________
AVISO LEGAL
El trading implica riesgos. Este indicador está destinado solo para análisis técnico — siempre aplica una gestión adecuada del riesgo y opera con responsabilidad.
COMENTARIOS Y MEJORAS
Si tienes sugerencias, solicitudes de funciones o ideas para mejorar, por favor deja un comentario en la pestaña de Discusión. Tus comentarios ayudan a mejorar el indicador para todos.
Resumen
Key features include customizable lookback periods based on bar count or specific date/time ranges, dynamic or fixed profile widths, and display options for proportional or full-width volume bars. Users can toggle visibility of all levels or key levels (POC, VAH, VAL) and adjust colors independently for bullish/bearish bars and delta text. The indicator tracks Initial Balance (IB) ranges and marks IB High/Low for day trading structure.
Performance optimizations include binary search for DateTime lookups, cached volume calculations, and efficient data structures to minimize recalculations. The indicator uses tick volume, which counts price changes rather than actual traded volume, making it suitable as a market activity meter rather than a measure of real money flow or liquidity.
Supported markets include Forex, Indices, Commodities, Crypto, and Stocks. The indicator is intended for technical analysis and includes parameters for timezone offset and text positioning.
Valoraciones de clientes
5 | 100 % | |
4 | 0 % | |
3 | 0 % | |
2 | 0 % | |
1 | 0 % |