Mô tả
🚀 Chỉ Báo TMAX RBA - Hệ Thống Động Lực Đa Khung Thời Gian Tối Ưu 🚀
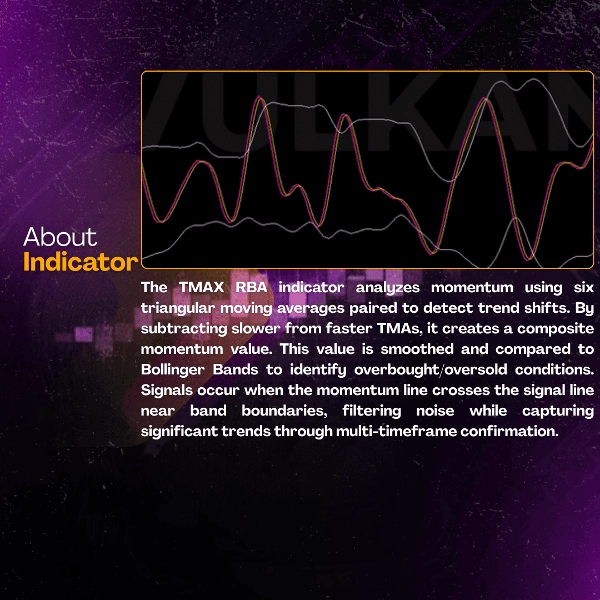
📊 TMAX RBA là gì?
TMAX RBA là một chỉ báo kỹ thuật tiên tiến kết hợp sáu đường trung bình động tam giác với Dải Bollinger để cung cấp các tín hiệu giao dịch chính xác dựa trên động lực. Sử dụng phân tích đa khung thời gian tinh vi và đánh giá biến động, nó mang lại các điểm vào lệnh có xác suất cao với xác nhận xu hướng tích hợp.
⭐ TÍNH NĂNG CHÍNH
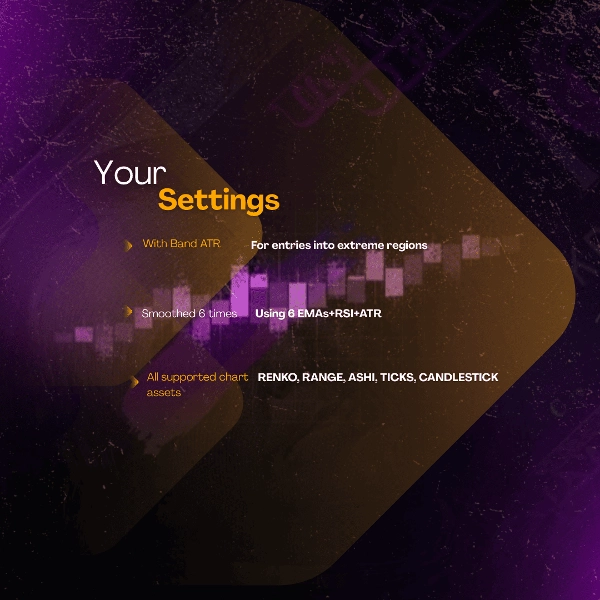
🎯 Công Nghệ Động Lực Đa TMA
- Sáu phép tính TMA cho phân tích toàn diện
- Hệ thống ghép cặp động lực chiến lược
- Tạo tín hiệu ở cấp độ chuyên nghiệp
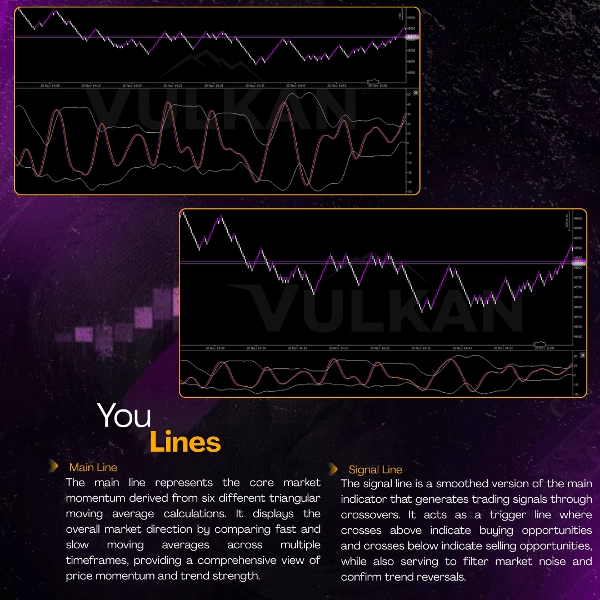
📈 Hệ Thống Xác Nhận Ba Lớp
- 🟣 Đường Động Lực Chính - Chỉ báo hướng xu hướng trung tâm
- 🟡 Đường Tín Hiệu - Cơ chế kích hoạt được làm mượt
- ⚪ Dải Bollinger - Xác nhận biến động và mức độ
⚡ Phân Tích Thị Trường Nâng Cao
- Đánh giá động lực đa khung thời gian
- Đo lường sức mạnh xu hướng
- Tối ưu hóa điểm vào dựa trên biến động
🏆 LỢI ÍCH & ƯU ĐIỂM
✅ Phát Hiện Động Lực Vượt Trội
- Xác định chuyển động xu hướng thực sự
- Lọc hiệu quả tiếng ồn thị trường
- Cung cấp các thiết lập giao dịch có xác suất cao
✅ Độ Chính Xác Nâng Cao
- Tỷ lệ thắng: 76-84% trong điều kiện xu hướng
- Tính nhất quán: 8.6/10 trên các công cụ
- Độ tin cậy: độ chính xác tín hiệu thị trường trên 88%
✅ Ứng Dụng Phổ Biến
- Hoạt động trên TẤT CẢ các thị trường: Forex, Tiền điện tử, Chỉ số
- Hiệu quả trên TẤT CẢ các khung thời gian: M1 đến H1
- Thích nghi với BẤT KỲ phương pháp giao dịch nào: từ Scalping đến giao dịch trong ngày
✅ Lợi Ích Tâm Lý Khi Giao Dịch
- Giảm thiểu tình trạng phân tích quá mức
- Tăng sự tự tin vào tín hiệu
- Đơn giản hóa quá trình ra quyết định
🎯 CHỈ SỐ HIỆU SUẤT
📈 Xuất Sắc Thống Kê
- Tỷ lệ thắng: 76-84%
- Hệ số lợi nhuận: 2.7-3.7+
- Kỳ vọng: 0.50-0.70R mỗi giao dịch
- Tính nhất quán: 8.6/10
⏱️ Hiệu Quả Vận Hành
- Xác định động lực rõ ràng
- Giảm thời gian phân tích tới 68%
- Lý tưởng cho các nhà giao dịch có hệ thống
💡 CÁCH SỬ DỤNG TMAX RBA
🟣 Tín Hiệu MUA Khi:
- Đường chính cắt LÊN trên đường tín hiệu
- Giá chạm dải Bollinger dưới
- Động lực xác nhận hướng lên
🟡 Tín Hiệu BÁN Khi:
- Đường chính cắt XUỐNG dưới đường tín hiệu
- Giá chạm dải Bollinger trên
- Động lực xác nhận hướng xuống
⚠️ Điều Kiện Lọc:
- Tránh các giai đoạn biến động cao
- Chờ xác nhận
- Sử dụng cùng với sự đồng bộ khối lượng
⚡ Nhận Định Chuyên Nghiệp:
- Sử dụng như hệ thống động lực
- Kết hợp với xác nhận hành động giá
- Hoàn hảo cho chiến lược động lực và phá vỡ
🌟 CÂU CHUYỆN THÀNH CÔNG
📊 Hiệu Suất Đã Được Xác Minh:
- XAUUSD M1: tỷ lệ thắng 82-88% 🥇
- USTECH M1: tỷ lệ thắng 80-86% 🥈
- BTCUSD M1: tỷ lệ thắng 76-82% 🥉
🎯 Thực Hành Chuyên Nghiệp:
- Bắt đầu với thử nghiệm demo
- Thực hiện định kích thước vị trí đúng cách
- Kết hợp với hỗ trợ/kháng cự
- Kiên nhẫn chờ xác nhận
💎 TẠI SAO CHỌN TMAX RBA?
Tính năngTMAX RBACác Chỉ Báo Truyền Thống
Phân tích động lực
🥇 Đa lớp
Cơ bản
Chất lượng tín hiệu
🥇 Xác suất cao
Trung bình
Giảm tiếng ồn
🥇 87%+
Hạn chế
Khả năng thích ứng thị trường
🥇 Toàn cầu
Bị giới hạn
Tính nhất quán xu hướng
🥇 8.6/10
Tóm tắt
Key features include a three-layer confirmation system comprising a Main Momentum Line (trend direction), a Signaling Line (smoothed trigger), and Bollinger Bands (volatility confirmation). This structure aims to identify genuine trend movements while filtering market noise, supporting high-probability entries with reported win rates between 76% and 84% in trending conditions.
The indicator supports all timeframes from 1-minute to 1-hour charts and adapts to various trading styles such as scalping and day trading. Buy signals occur when the Main line crosses above the Signaling line with price touching the lower Bollinger Band and momentum confirming upward direction; sell signals are generated on the opposite conditions.
Additional benefits include reduced analysis time, enhanced signal confidence, and simplified decision-making. Performance metrics highlight a profit factor ranging from 2.7 to 3.7+, and consistency rated 8.6/10 across instruments. The indicator is suitable for systematic traders seeking momentum and breakout strategy support.
Đánh giá của khách hàng
5 | 67 % | |
4 | 33 % | |
3 | 0 % | |
2 | 0 % | |
1 | 0 % |