
New Way Sar - Free
مؤشر
135 التنزيلات
الإصدار 1.0، Sep 2025
Windows, Mac
5.0
التقييمات: 1
الوصف
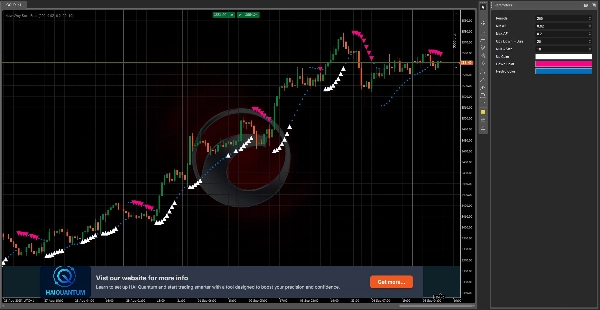
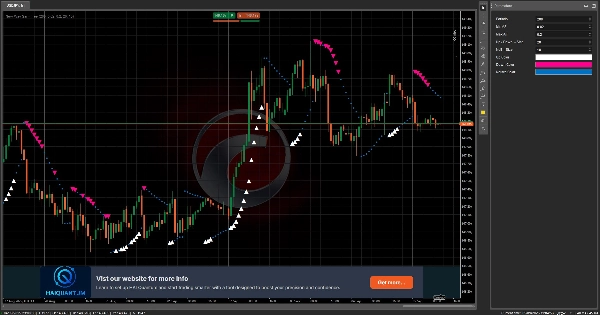
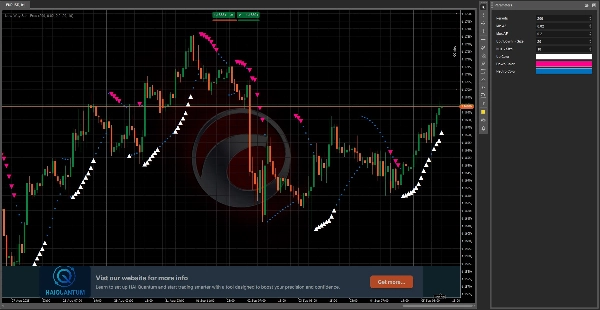
مؤشر التوقف والانعكاس (Parabolic SAR) هو أداة تحليل فني ديناميكية تساعد المتداولين على تحديد احتمالات انعكاس الاتجاهات وتعيين أوامر وقف الخسارة المتحركة. على عكس المؤشرات التقليدية، يقوم مؤشر التوقف والانعكاس بإنشاء سلسلة من النقاط التي تتبع حركة السعر، وتتعدل مع اكتساب الاتجاه للزخم.
نسختنا الحديثة تقدم نهجًا جديدًا وبديهيًا لهذا المؤشر الكلاسيكي. من خلال الجمع بين إشارات قوية وموثوقة وتصميم نظيف وحديث، يساعد المتداولين على تصور اتجاه الاتجاه ونقاط الدخول أو الخروج المحتملة بسهولة. سواء كنت متداولًا متمرسًا أو مبتدئًا، يوفر مؤشر التوقف والانعكاس: النسخة الحديثة الوضوح والدقة التي تحتاجها للتنقل في الأسواق بثقة.
الملخص
ملف تعريف المؤشر
تقييمات العملاء
5.0
التقييمات: 1
5 | 100 % | |
4 | 0 % | |
3 | 0 % | |
2 | 0 % | |
1 | 0 % |
تقييمات العملاء
October 8, 2025
A fresh twist on the classic SAR! ⚙️ Fast, light, and easy to read. Great for spotting quick trend flips, but add filters to avoid false turns on choppy markets."
مناقشة
الأسئلة الشائعة
Prop
Forex
Signal
Indices
Supertrend
Commodities
Crypto
Stocks
يتم توفير المنتجات المتاحة من خلال cTrader Store، بما في ذلك روبوتات التداول والمؤشرات والإضافات، من قبل مطوري الطرف الثالث وإتاحتها لأغراض الوصول المعلوماتي والفني فقط. cTrader Store ليس وسيطًا ولا يقدم نصائح استثمارية أو توصيات شخصية أو أي ضمان للأداء المستقبلي.


السعر
147
المبيعات
11.19K
التثبيتات المجانية