
Cutrim Theory
مؤشر
174 التنزيلات
الإصدار 1.4، Jun 2026
Windows, Mac
الوصف
TeoriaCutrim هو مؤشر تراكبي إحصائي مصمم لقياس سلوك السوق الأخير من خلال توزيع الشموع وتحليل التقلبات. بدلاً من التنبؤ بالاتجاه، فإنه يوفر بيانات موضوعية حول ما فعله السوق للتو ضمن نافذة قابلة للتكوين من الشموع.
البيانات السوقية المحللة
يقوم المؤشر بتقييم عدد محدد من الشموع الأخيرة (فترة النظر للخلف) ويستخرج:
- عدد ونسبة الشموع الصاعدة (الإغلاق > الافتتاح)
- عدد ونسبة الشموع الهابطة (الإغلاق < الافتتاح)
- الفرق بين هيمنة الشموع الصاعدة والهابطة
- متوسط نطاق الشمعة (بالنقاط)
- نطاق الشمعة الحالية (بالنقاط)
- إجمالي نطاق السعر عبر النافذة المحللة
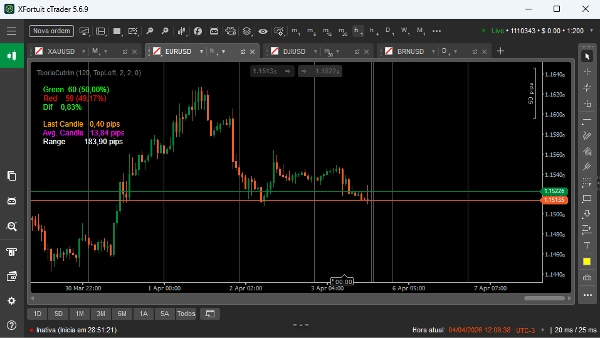
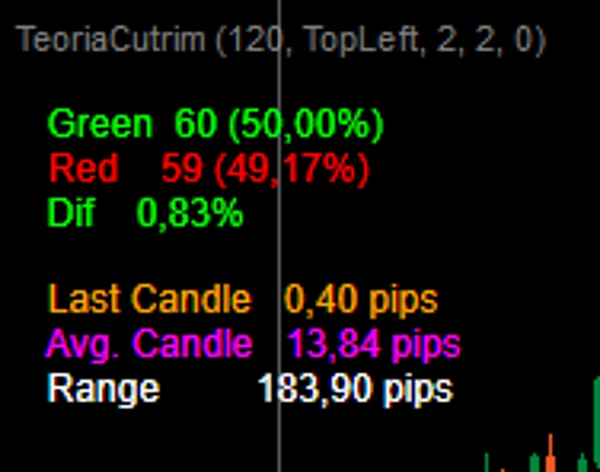
المخرجات البصرية والتفسير
يعرض المؤشر المقاييس الرئيسية مباشرة على الرسم البياني:
- أخضر: إجمالي الشموع الصاعدة والنسبة المئوية
- أحمر: إجمالي الشموع الهابطة والنسبة المئوية
- الفرق: الفرق المطلق بين نسب الشموع الصاعدة والهابطة
- الشمعة الأخيرة: حجم الشمعة الحالية بالنقاط
- متوسط الشمعة: متوسط حجم الشموع في النافذة المختارة
- النطاق: المسافة بين أعلى قمة وأدنى قاع في النافذة
التفسير بسيط:
- عدد أكبر من الشموع الصاعدة يشير إلى ضغط صعودي حديث
- عدد أكبر من الشموع الهابطة يشير إلى ضغط هبوطي حديث
- فرق منخفض (الفرق) يشير إلى توازن أو عشوائية
- زيادة متوسط حجم الشمعة تشير إلى توسع التقلبات
- نطاق إجمالي كبير يشير إلى توسع السوق، بينما يشير النطاق الصغير إلى انضغاط
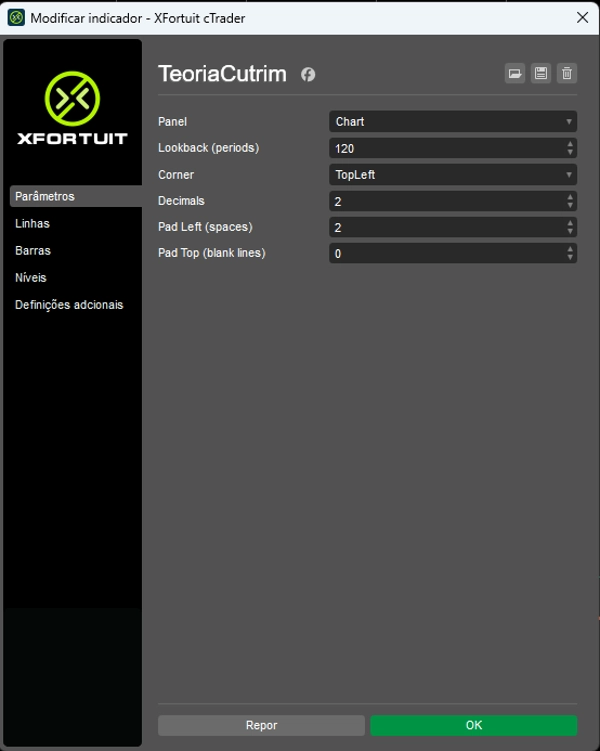
المعلمات الرئيسية
- فترة النظر للخلف: عدد الشموع المستخدمة للتحليل (قابل للتعديل بالكامل)
- الزاوية: موقع عرض البيانات على الشاشة
- الأرقام العشرية: عدد المنازل العشرية المعروضة
- التباعد الأيسر / العلوي: تعديلات التباعد البصري
حالات الاستخدام
يُستخدم TeoriaCutrim بشكل أفضل كأداة سياقية، وليس كمولد إشارات. تشمل التطبيقات النموذجية:
- قياس عدم التوازن الإحصائي قبل الدخول في الصفقات
- تحديد توسع أو انكماش التقلبات
- تصفية الصفقات بناءً على سلوك الشموع الأخيرة
- دعم الاستراتيجيات الكمية أو القائمة على الاحتمالات
المستخدم المستهدف
تم تصميم هذا المؤشر للمتداولين الذين يعتمدون على البيانات والإحصاءات والتحليل الموضوعي بدلاً من التعرف على الأنماط الذاتية. مناسب لكل من المتداولين التقديريين والمنهجيين.
الملخص
ملخص الذكاء الاصطناعي
Cutrim Theory is a statistical overlay indicator that analyzes recent market behavior by examining a user-defined number of candles. It quantifies candle dominance, difference, and volatility in pips without predicting market direction. The indicator calculates and displays on the chart: the number and percentage of bullish and bearish candles, the absolute difference between bullish and bearish dominance, the current candle size, the average candle size, and the total price range within the selected window. These metrics help traders assess recent upward or downward pressure, market balance, and volatility expansion or contraction. Adjustable parameters include the lookback period, display position, decimal precision, and visual spacing. Designed for traders who prefer data-driven, objective analysis, Cutrim Theory serves as a context tool to measure statistical imbalances, identify volatility changes, filter trades based on candle behavior, and support quantitative or probability-based strategies. It is applicable to Forex markets, including EURUSD.
ملف تعريف المؤشر
تقييمات العملاء
0.0
التقييمات: 0
تقييمات العملاء
لا توجد تقييمات لهذا المنتج حتى الآن. هل جرَّبته بالفعل؟ كن أول من يخبر الآخرين!
مناقشة
الأسئلة الشائعة
Forex
EURUSD
يتم توفير المنتجات المتاحة من خلال cTrader Store، بما في ذلك روبوتات التداول والمؤشرات والإضافات، من قبل مطوري الطرف الثالث وإتاحتها لأغراض الوصول المعلوماتي والفني فقط. cTrader Store ليس وسيطًا ولا يقدم نصائح استثمارية أو توصيات شخصية أو أي ضمان للأداء المستقبلي.


السعر
منذ 31/03/2025
453.61M
حجم التداول
759.55K
الربح بالبيب
174
التثبيتات المجانية