
الوصف
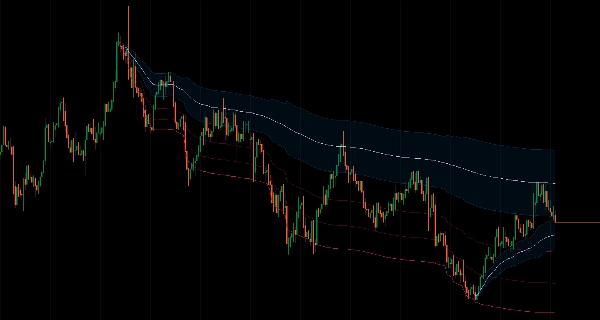
قفل حساب المتوسط المتحرك على أي لحظة في السوق وتتبع سلوك السعر مع تمدده للأمام.
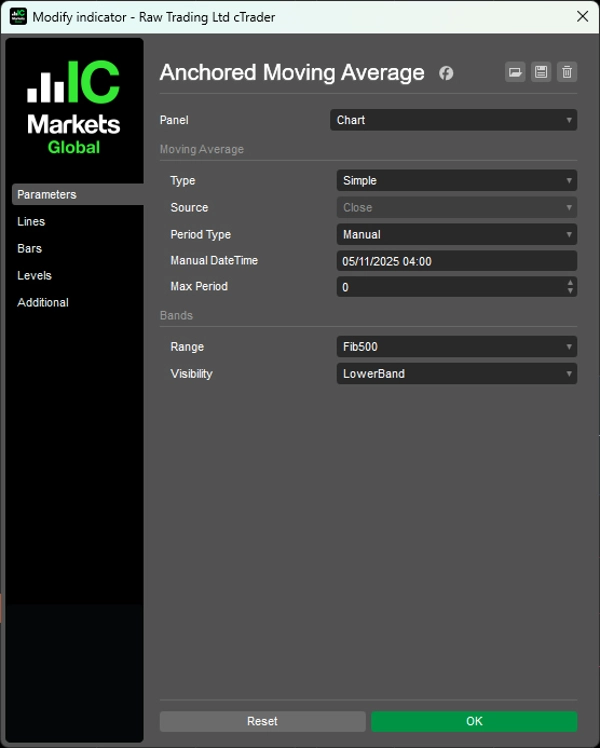
يثبت الحساب على نقطة البداية التي تختارها (تاريخ ووقت يدوي أو فترة استرجاع من ساعة إلى 10 سنوات)، ثم ينمو بشكل طبيعي مع أشرطة فيبوناتشي التكيفية بناءً على نطاق السعر الفعلي.
ثمانية مستويات فيبوناتشي (من 11.4% إلى 100%) تتكيف مع حركة السعر الحقيقية، منطقة ارتداد متوسط مدمجة من 38.2%-62.8%، نوعان من المتوسطات المتحركة (SMA/EMA)، أوضاع عرض متعددة (الأشرطة الكاملة، الحدود القصوى فقط، منطقة الارتداد فقط)، ومحدد فترة قصوى للأطر الزمنية الطويلة توفر تتبع زخم قائم على الأحداث للمتداولين الذين يستهدفون التصحيحات من نقاط التأرجح المهمة وتحليل سلوك السعر بعد الحدث.
الميزات
الحساب المرتكز على الوقت
- على عكس المتوسطات المتحركة القياسية التي تستخدم فترات ثابتة، هذا ينمو بشكل طبيعي من نقطة البداية التي تختارها
- تثبيت مرن: تعيين تاريخ ووقت يدوي أو استخدام فترات استرجاع محددة مسبقًا (من ساعة إلى 10 سنوات)
- تتبع الزخم من لحظات السوق المهمة
- نقاط تثبيت متسقة عبر أطر زمنية مختلفة
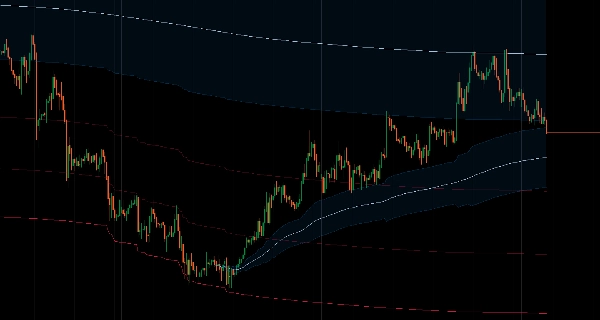
أشرطة فيبوناتشي التكيفية
- أشرطة محسوبة تلقائيًا بناءً على نطاق السعر الفعلي، وليس مضاعفات ATR عشوائية
- 8 مستويات فيبوناتشي (من 11.4% إلى 100%) تتكيف مع حركة السعر الحقيقية
- مناطق ارتداد المتوسط: منطقة ارتداد مدمجة من 38.2%-62.8% لمناطق دخول ذات احتمالية عالية
- مناطق احتمالية معرفة رياضيًا
نوعان من المتوسطات المتحركة
- المتوسط المتحرك البسيط
- المتوسط المتحرك الأسي
- محدد فترة قصوى: لمنع التنعيم المفرط على الأطر الزمنية الطويلة
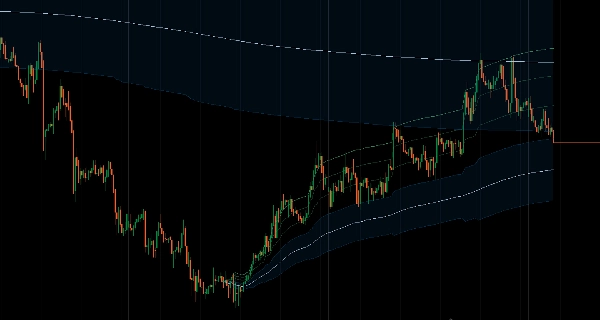
أوضاع عرض متعددة
- الأشرطة الكاملة: جميع مستويات فيبوناتشي مرئية
- الأعلى/الأدنى فقط: عرض الحدود القصوى
- منطقة الارتداد فقط: التركيز على منطقة ارتداد المتوسط
- تصميم نظيف وهادف بدون فوضى
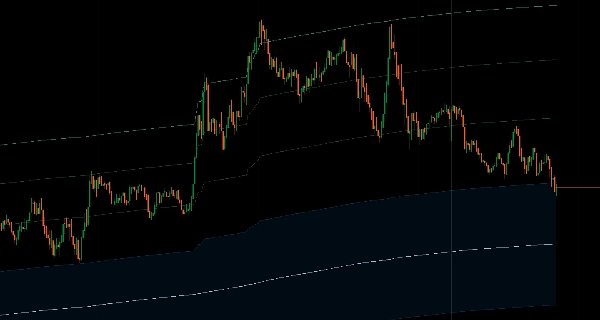
التحليل القائم على الأحداث
- شاهد كيف يرتبط السعر الحالي بالحركة من المستويات المهمة
- تتبع سلوك السعر بعد الحدث
- دخولات مبنية على الهيكل مع نقاط مرجعية واضحة
__________________________________________________________________________________________
مزيد من المؤشرات المجانية
استكشف مجموعة واسعة من أدوات تحليل السوق — من الهيكل والحجم إلى الانحدار والتقلبات والأطر الزمنية المخصصة.
رمز المصدر متاح على مستودع GitHub.
جميعها مجانية للاستخدام. ولكن إذا رغبت في تقديم دعم قهوة، يمكنك توجيهه من هنا.
الدعم/المقاومة
الحجم
- محلل نشاط الحجم
- محلل كفاءة الحجم
- تحليلات ملف الحجم
- ملف الحجم - محدث
- تحليل انتشار الحجم
- VWAP (متوسط السعر المرجح بالحجم)
المتوسطات المتحركة
- قناة SSL
- المتوسط المتحرك المثبت
- المتوسط المتحرك بمقياس الانحراف
- منشط جان العالي والمنخفض
- خط الاتجاه اللحظي
- متوسط كوفمان التكيفي مع رؤية الاتجاه
- قناة المتوسط المتحرك
- مجموعة المتوسطات المتحركة
- متوسط قناة الاتجاه
الأدوات/المخصصة
قائم على الانحدار
التقلب
المذبذبات
__________________________________________________________________________________________
إخلاء المسؤولية
التداول ينطوي على مخاطر. هذا المؤشر مخصص للتحليل الفني فقط — دائماً طبق إدارة مخاطر مناسبة وتداول بمسؤولية.
التعليقات والتحسينات
إذا كانت لديك اقتراحات أو طلبات ميزات أو أفكار للتحسين، يرجى ترك تعليق في تبويب النقاش. تساعد ملاحظاتك في تحسين المؤشر للجميع.
الملخص
تقييمات العملاء
5 | 100 % | |
4 | 0 % | |
3 | 0 % | |
2 | 0 % | |
1 | 0 % |


![شعار "[Hamster-Coder] Pivot Points MTF"](https://cdn.ctrader.com/image/webp/4c143e5a-309c-40e3-a578-f04d1e133ffa_31159)


