
PDHL
مؤشر
1.83K التنزيلات
الإصدار 1.0، Sep 2024
Windows, Mac
2.5
التقييمات: 2
الوصف
تقديم مؤشر التداول الأعلى-الأدنى
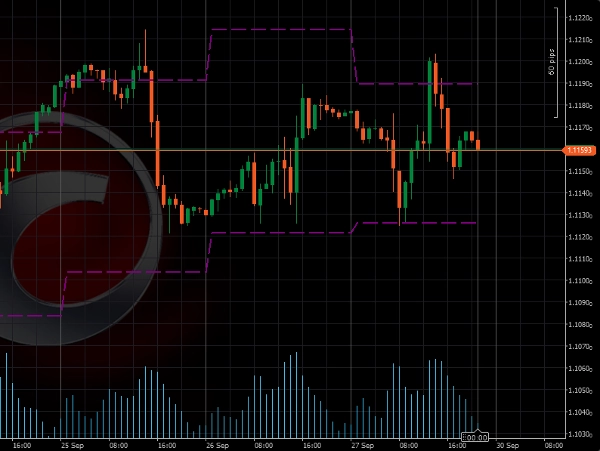
تم تصميم هذا المؤشر لرسم أعلى وأدنى مستويات السعر لليوم السابق تلقائيًا على الرسم البياني الخاص بك. تساعدك هذه الأداة على تحديد المستويات الرئيسية بسرعة للاحتمالات المحتملة للاختراقات والانعكاسات.
الفوائد الرئيسية:
- مثالي لتداول الاختراقات: يبرز هذا المؤشر مستويات السعر الحرجة من اليوم السابق، والتي غالبًا ما تُستخدم كنقاط مرجعية لاستراتيجيات الاختراق. يمكن أن يوفر التداول فوق أو تحت هذه المستويات إعدادات ذات إمكانات عالية.
- بسيط ولكنه فعال: يركز مؤشر التداول الأعلى-الأدنى على أحد أهم جوانب حركة السعر – أعلى وأدنى سعر لليوم السابق. من خلال دمج هذه المستويات في استراتيجيتك، تحصل على فهم أوضح لهياكل السوق ونقاط التحول المحتملة.
تنبيهات:
- الأفضل استخدامه على أطر زمنية أقل من يوم واحد
الإعدادات:
- تضمين يوم الأحد: الافتراضي = لا
الملخص
ملخص الذكاء الاصطناعي
The PDHL (Previous Day High & Low) indicator automatically plots the prior day's highest and lowest price levels on trading charts. It is designed to assist traders in identifying key price levels that may signal potential breakouts or reversals. By highlighting these critical levels, the indicator supports breakout trading strategies, providing reference points for entering trades when price moves above or below the previous day's range. The tool emphasizes simplicity and effectiveness by focusing on essential price action elements, helping traders better understand market structure and potential turning points. It is best used on intraday timeframes shorter than one day. A configurable setting allows users to include or exclude Sunday in the calculation, with the default setting excluding it.
ملف تعريف المؤشر
تقييمات العملاء
2.5
التقييمات: 2
5 | 0 % | |
4 | 0 % | |
3 | 50 % | |
2 | 50 % | |
1 | 0 % |
تقييمات العملاء
October 9, 2025
What Timezone is it in at default? It seems to fail to get the accurate Highs and lOws for different istruments. You could add that as a customisable input. Please add closing price too
July 9, 2025
Pros: Simple and clear display of previous day's high/low levels. Stable performance. Easy to use and customize. Cons: No breakout alerts. No visual zone fill option. Lacks additional filters or Fibo levels.
مناقشة
الأسئلة الشائعة
Breakout
يتم توفير المنتجات المتاحة من خلال cTrader Store، بما في ذلك روبوتات التداول والمؤشرات والإضافات، من قبل مطوري الطرف الثالث وإتاحتها لأغراض الوصول المعلوماتي والفني فقط. cTrader Store ليس وسيطًا ولا يقدم نصائح استثمارية أو توصيات شخصية أو أي ضمان للأداء المستقبلي.
المزيد من هذا المؤلف


السعر
منذ 24/09/2024
4.45K
التثبيتات المجانية