
الوصف
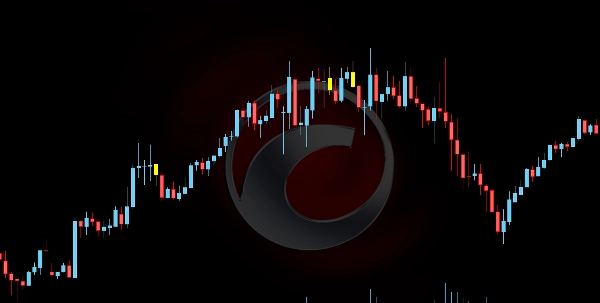
مؤشر Dark Cloud Cover هو أداة تحليل فني مصممة لتحديد أنماط الانعكاس الهبوطي المحتملة في السوق. يتكون هذا النمط من شمعتين متتاليتين:
- شمعة صعودية (خضراء) تشير إلى زخم شراء قوي.
- شمعة هبوطية (حمراء) تفتح فوق إغلاق الشمعة السابقة لكنها تغلق تحت منتصف الشمعة السابقة، مما يشير إلى ضغط بيع.
تشير هذه التشكيلة إلى احتمال حدوث تحول في معنويات السوق، حيث يفقد المشترون السيطرة ويتولى البائعون الأمر.
الميزات والوظائف:
- كشف النمط:
-
- يقوم المؤشر بمسح نمط Dark Cloud Cover بناءً على حركة سعر الشمعة.
- عند الكشف عنه، يبرز النمط بصريًا لتنبيه المتداولين.
- مرشح الاتجاه (اختياري):
-
- لتحسين الدقة، يتضمن المؤشر مرشح اتجاه اختياري باستخدام المتوسط المتحرك (MA).
- إذا تم تفعيله، يُعتبر النمط صالحًا فقط عند حدوثه في اتجاه صاعد.
- منطق التأكيد:
-
- يمكن للمؤشر التحقق من صحة الإشارة الهبوطية بفحص الشمعة التالية.
- يتم تحديد شمعة التأكيد إذا أغلقت تحت Dark Cloud Cover المنخفضة وكان حجم التيك أعلى من متوسط الشموع الأخيرة.
- هذا يضمن موثوقية أقوى للإشارة.
- علامات بصرية:
-
- الشموع الصفراء: تميز نمط Dark Cloud Cover المكتشف.
- الشموع البرتقالية: تبرز شمعة التأكيد إذا تم استيفاء شروط الحجم.
يساعد هذا المؤشر المتداولين على اكتشاف إعدادات انعكاس ذات احتمالية عالية، مما يحسن اتخاذ القرار للدخول القصير أو استراتيجيات إدارة المخاطر.
الملخص
ملخص الذكاء الاصطناعي
The Dark Cloud Cover indicator is a technical analysis tool that identifies a specific bearish reversal candlestick pattern. This pattern consists of two candles: a bullish (green) candle indicating strong buying momentum, followed by a bearish (red) candle that opens above the previous close but closes below the midpoint of the prior candle, signaling selling pressure and a potential shift from buyers to sellers.
Key features include:
- **Pattern Detection:** Automatically scans for the Dark Cloud Cover pattern based on candlestick price action and visually highlights detected patterns for trader awareness.
- **Optional Trend Filter:** Incorporates a Moving Average (MA) filter to validate patterns only during uptrends, enhancing signal accuracy.
- **Confirmation Logic:** Validates bearish signals by analyzing the subsequent candle, which must close below the pattern’s low with higher-than-average tick volume to confirm the reversal.
- **Visual Markers:** Uses yellow candles to mark detected patterns and orange candles to highlight confirmation candles meeting volume criteria.
This indicator assists traders in recognizing high-probability bearish reversal setups, supporting decision-making for short entries and risk management strategies.
ملف تعريف المؤشر
تقييمات العملاء
0.0
التقييمات: 0
تقييمات العملاء
لا توجد تقييمات لهذا المنتج حتى الآن. هل جرَّبته بالفعل؟ كن أول من يخبر الآخرين!
مناقشة
الأسئلة الشائعة
Signal
يتم توفير المنتجات المتاحة من خلال cTrader Store، بما في ذلك روبوتات التداول والمؤشرات والإضافات، من قبل مطوري الطرف الثالث وإتاحتها لأغراض الوصول المعلوماتي والفني فقط. cTrader Store ليس وسيطًا ولا يقدم نصائح استثمارية أو توصيات شخصية أو أي ضمان للأداء المستقبلي.
المزيد من هذا المؤلف


السعر
5
المبيعات
436
التثبيتات المجانية