
Candle Timer & Strength Demo
مؤشر
267 التنزيلات
الإصدار 1.0، Jul 2025
Windows, Mac
الوصف
الميزات الرئيسية:
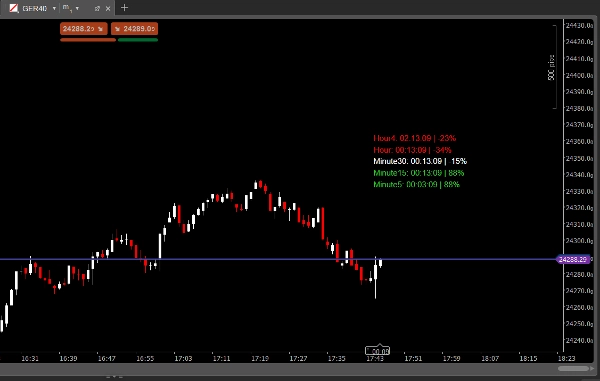
- مؤقتات الشموع متعددة الأطر الزمنية:
شاهد العد التنازلي لإغلاق الشمعة التالية على ما يصل إلى 5 أطر زمنية مختارة، كلها في لوحة واضحة واحدة. - قوة الشمعة بالنسبة المئوية:
عرض فوري لقوة الشمعة الحالية (من -100% إلى +100%) لكل إطار زمني، بناءً على مكان الإغلاق بالنسبة لنطاق الشمعة. - لوحة قابلة للتخصيص:
-
- تعيين حجم الخط، والمسافة من الشمعة الأخيرة، والتباعد العمودي.
- اختر الأطر الزمنية المفضلة لديك (M1، M5، M15، M30، H1، H4، إلخ).
- الألوان تتغير تلقائيًا: الأخضر للاتجاه الصعودي القوي، الأحمر للاتجاه الهبوطي القوي، الأبيض للحيادي.
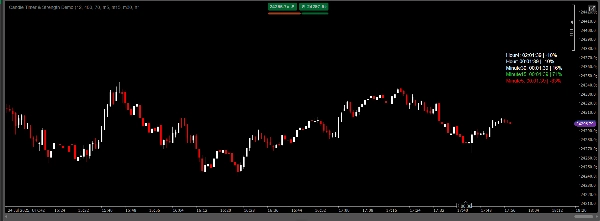
- دائمًا مرئية:
اللوحة مرئية دائمًا على الرسم البياني الخاص بك، مما يسهل مراقبة توقيت السوق والزخم بنظرة سريعة. - مثالية لـ:
-
- المتداولين السريعين والمتداولين اليوميين الذين يحتاجون إلى توقيت دقيق للشموع.
- المتداولين متعددين الأطر الزمنية الذين يرغبون في رؤية الزخم والتوقيت في مكان واحد.
- أي شخص يرغب في تحسين توقيت الدخول/الخروج ومهارات قراءة الشموع.
كيف يعمل:
- يقوم المؤشر بحساب الوقت المتبقي حتى إغلاق الشمعة الحالية لكل إطار زمني مختار.
- كما يحسب قوة الشمعة كنسبة مئوية:
-
- +100% = الإغلاق في أعلى الشمعة تمامًا (اتجاه صعودي قوي)
- -100% = الإغلاق في أسفل الشمعة تمامًا (اتجاه هبوطي قوي)
- 0% = الإغلاق في المنتصف (حيادي)
- تتحدث اللوحة في الوقت الحقيقي وقابلة للتخصيص بالكامل.
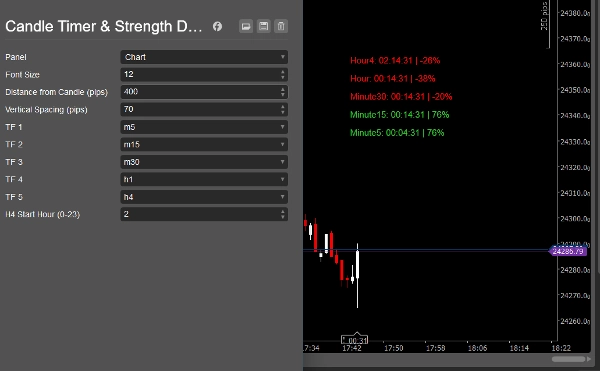
المعلمات:
- حجم الخط
- المسافة من الشمعة (نقاط)
- التباعد العمودي (نقاط)
- الإطار الزمني 1–5 (مخصص)
- ساعة بدء H4 (لوسطاء الشموع H4 غير القياسية)
لماذا تختار مؤقت وقوة الشمعة؟
- وفر الوقت: لا حاجة لتبديل الأطر الزمنية أو حساب إغلاق الشموع في ذهنك بعد الآن.
- تداول بثقة: شاهد فورًا إذا كان السوق يكتسب أو يفقد الزخم.
- مظهر احترافي: لوحة نظيفة وعصرية تناسب أي نمط رسم بياني.
- سهل الاستخدام: تشغيل مباشر، لا حاجة للبرمجة.
ملاحظة:
هذا العرض التجريبي لأغراض التقييم فقط.
إذا أعجبك المؤشر، يرجى شراء النسخة الكاملة للاستخدام غير المحدود.
للحصول على النسخة الكاملة، ابحث عن "Candle Timer & Strength" في متجر cTrader.
شاهد جميع مؤشرات وروبوتاتي:
https://ctrader.com/pl?search=kobud.222&u=kobud.222
http://www.youtube.com/@Robi22-22
📩 أسئلة؟ اقتراحات؟ خصم؟
التواصل متاح في ملفي الشخصي: Robikobud
الملخص
ملخص الذكاء الاصطناعي
Candle Timer & Strength Demo for cTrader is an indicator designed to display real-time countdowns to the close of current candles across up to five customizable timeframes. It provides a clear panel showing the remaining time until candle close and the candle’s strength as a percentage, ranging from -100% (strong bearish) to +100% (strong bullish), based on the candle’s close position relative to its range. The panel is fully customizable, allowing users to adjust font size, vertical spacing, distance from the last candle, and select preferred timeframes such as M1, M5, M15, M30, H1, and H4. Colors dynamically indicate momentum: green for strong bullish, red for strong bearish, and white for neutral. The panel remains always visible on the chart, facilitating quick assessment of market timing and momentum. This tool is suited for scalpers, day traders, and multi-timeframe traders seeking precise candle timing and momentum insights to improve entry and exit decisions. Parameters include font size, spacing, timeframe selection, and H4 start hour adjustment for brokers with non-standard candle timings. This demo version is intended for evaluation purposes.
ملف تعريف المؤشر
تقييمات العملاء
0.0
التقييمات: 0
تقييمات العملاء
لا توجد تقييمات لهذا المنتج حتى الآن. هل جرَّبته بالفعل؟ كن أول من يخبر الآخرين!
مناقشة
الأسئلة الشائعة
يتم توفير المنتجات المتاحة من خلال cTrader Store، بما في ذلك روبوتات التداول والمؤشرات والإضافات، من قبل مطوري الطرف الثالث وإتاحتها لأغراض الوصول المعلوماتي والفني فقط. cTrader Store ليس وسيطًا ولا يقدم نصائح استثمارية أو توصيات شخصية أو أي ضمان للأداء المستقبلي.
المزيد من هذا المؤلف


السعر
منذ 31/12/2024
7
المبيعات
1.14K
التثبيتات المجانية