
الوصف
المؤشر يعتمد على تحليل حركة السعر 📈 لتحديد التغيرات في هيكل السوق والمناطق الرئيسية ذات الاهتمام. فيما يلي ملخص تفصيلي لكيفية عمله:
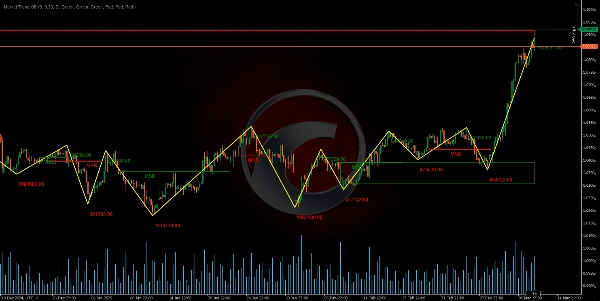
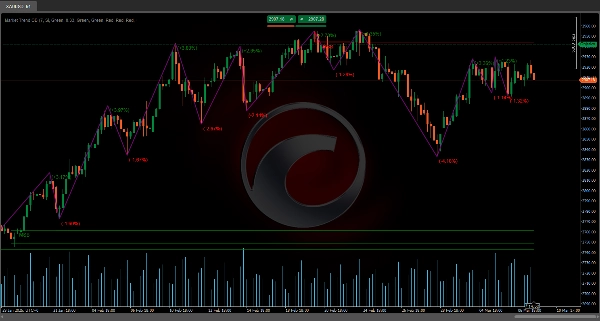
كشف النقاط المحورية وتشكيل نمط الزجزاج 🔄
يتم تحليل فترة محددة (يتم تعريفها بواسطة معلمة الطول) لتحديد القمم والقيعان النسبية. من خلال مقارنة الأسعار داخل تلك الفترة، نقاط المحور (نقاط الانعطاف) يتم اكتشافها، والتي بدورها تشكل نمط الزجزاج ⚡. هذا النمط يساعد في التمييز متى يحدث انعكاس السعر.
تراكم الحجم وحساب الانحراف 📊
خلال عملية كشف النقاط المحورية، يتم تجميع حجم التيك في الجزء المقيم. بالإضافة إلى ذلك، يتم حساب الفرق النسبي بين أسعار النقاط المحورية لتحديد ما إذا كانت الحركة كبيرة بما فيه الكفاية. يتم مقارنة هذا الانحراف بعتبة محددة، مما يساعد في تأكيد أن التغير في الهيكل حقيقي ✅.
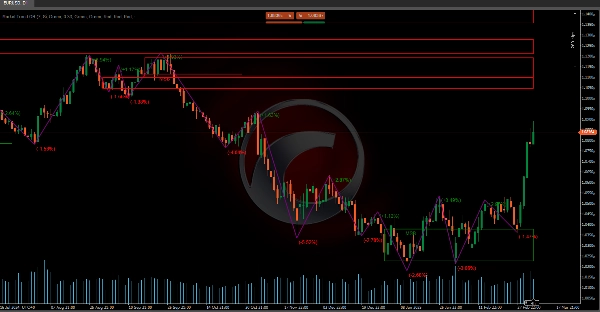
تعريف كسر هيكل السوق (MSB) 🚨
يقوم المؤشر بتقييم آخر نقطتين محوريتين (سواء كانت قمم أو قيعان) ومن خلال تطبيق عامل الارتداد (مستوحى من مستويات فيبوناتشي)، يحدد ما إذا كان قد حدث كسر في الهيكل.
- إذا، بعد كسر قمة قديمة، بدأ السعر في توليد قيعان أدنى، يتم التعرف على تحول إلى هيكل هبوطي 🐻.
- وبالمثل، إذا بعد كسر قاع قديم، يولد السعر قمم أعلى، يُفترض انتقال إلى هيكل صعودي 🐂.
يتم تفسير هذا التغير على أنه كسر هيكل السوق (MSB).
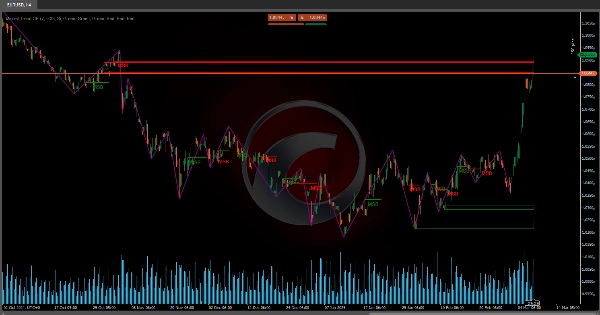
تحديد كتل الأوامر وصناديق الاختراق 📦
بمجرد اكتشاف MSB، يتم تحديد المناطق الحرجة بناءً على حركة السعر السابقة:
- كتل الأوامر (OB) 🧱: يتم التعرف عليها كمناطق حدث فيها آخر حركة مهمة قبل الاختراق. في الهيكل الهبوطي، يتم أخذ آخر شمعة صعودية قبل القمة الجديدة؛ في الهيكل الصعودي، يتم استخدام آخر شمعة هبوطية قبل القاع الجديد.
- صناديق الاختراق (BB) 📈: يتم تحديدها بطريقة مماثلة ولكن تأخذ في الاعتبار نطاقًا إضافيًا لتأكيد أن السعر اخترق المستوى السابق.
تساعد هذه المناطق في تحديد المناطق التي يتركز فيها النشاط وقد تعمل كـ دعم أو مقاومة في المستقبل.
تصوير بيانات الزجزاج ذات الصلة 📊
بالإضافة إلى رسم تسلسل النقاط المحورية، يدمج المؤشر بيانات إضافية:
- سعر الانعكاس 💹: يتم تسجيل القيمة الدقيقة حيث يتم اكتشاف تغير الاتجاه.
- نسبة التغير في الانعكاس 🔄: يتم حساب النسبة المئوية بين سعر النقطة المحورية الجديدة والسابقة، مما يشير إلى حجم التغير.
- الحجم المتراكم 📉: يتم عرض مجموع حجم التيك خلال الجزء المؤدي إلى تشكيل النقطة المحورية.
تسمح هذه البيانات بتقييم قوة وأهمية الحركة دون الاعتماد على الافتراضات، لأنها تستند إلى حسابات ملموسة.
باختصار، تقوم الأداة بتحليل حركة السعر لاكتشاف متى يغير السوق اتجاهه (MSB) وتحدد مناطق (كتل الأوامر وصناديق الاختراق) التي يمكن أن تكون مفتاحية لـ قرارات التداول 💼. دمج نمط الزجزاج مع تحليل الحجم و الانحرافات النسبية يوفر رؤية شاملة لهياكل السوق، مقدمًا معلومات دقيقة عن نقاط الانعكاس و قوة الحركة 💪.
مؤشرات متجر Ctrader:
هيكل السوق الديناميكي
تحليل نقاط الانعطاف
فيبوناتشي الخطي
انحدار متعدد الأطر الزمنية
تحيز الشمعة متعددة المستويات
المتعقب
الملخص
It defines Market Structure Breaks (MSB) by evaluating recent pivots with a retracement factor inspired by Fibonacci levels. A break in structure is signaled when price action shifts from higher highs to lower lows (bearish) or from lower lows to higher highs (bullish).
Upon detecting an MSB, the indicator identifies critical zones: Order Blocks (OB), representing the last significant candle before a breakout, and Breakout Boxes (BB), which confirm price level breaches with an additional range. These zones serve as potential future support or resistance areas.
The tool visualizes relevant zigzag data, including reversal prices, percentage changes, and accumulated volume, enabling assessment of movement strength and relevance based on concrete calculations. This comprehensive approach integrates zigzag patterns, volume analysis, and deviation metrics to provide precise information on reversal points and market movement strength, supporting informed trading decisions.
تقييمات العملاء
5 | 100 % | |
4 | 0 % | |
3 | 0 % | |
2 | 0 % | |
1 | 0 % |


![شعار "[Hamster-Coder] Moving Average"](https://cdn.ctrader.com/image/webp/1bd952ad-57d2-4db2-9b49-b01be0b048b8_30113)


![شعار "[Hamster-Coder] Pivot Points MTF"](https://cdn.ctrader.com/image/webp/4c143e5a-309c-40e3-a578-f04d1e133ffa_31159)


