Описание
Этот индикатор cTrader идентифицирует и визуализирует первые конкретные рыночные дисбалансы, которые возникают в течение трёх основных торговых сессий Нью-Йорка. Он предназначен для практиков ICT (Inner Circle Trader), которые сосредоточены на "первоначально представленных" установках как на высоковероятных институциональных отпечатках.
核心 (Core) Функциональность
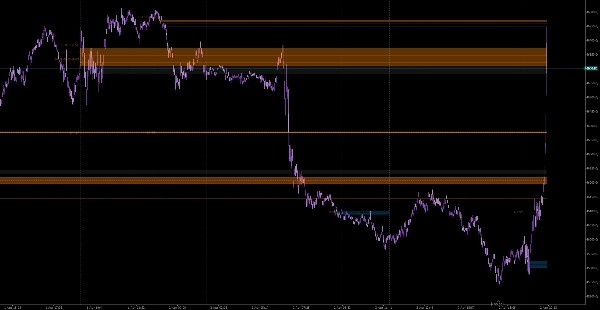
Индикатор отслеживает рынок, начиная с открытия каждой сессии, и "запирает" самый первый обнаруженный дисбаланс. Как только тип дисбаланса (например, FVG) нарисован для конкретной сессии, он не будет рисовать другой такого же типа до начала следующей сессии.
1. Обнаруженные типы дисбалансов
- Fair Value Gap (FVG): Структура из трёх свечей, где тень первой свечи и тень третьей свечи не перекрываются, оставляя "пробел" в ценовом диапазоне второй свечи.
- Volume Imbalance (VI): Возникает, когда существует разрыв между телами (открытие/закрытие) двух последовательных свечей, даже если тени перекрываются.
- Liquidity Void (LV): Более экстремальный разрыв, при котором отсутствует ценовое движение между тенями двух последовательных свечей (полный "прыжок" цены).
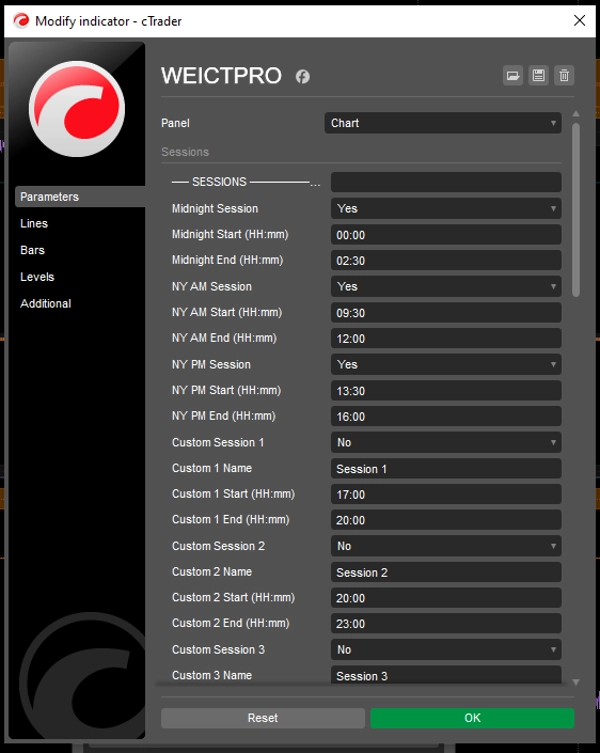
2. Отслеживаемые сессии (по времени Нью-Йорка)
Индикатор автоматически конвертирует время вашего графика в Восточное время (ET) для отслеживания:
- Полночь: 00:00 – 02:30
- NY AM: 09:30 – 12:00
- NY PM: 13:30 – 16:00
Визуальные особенности
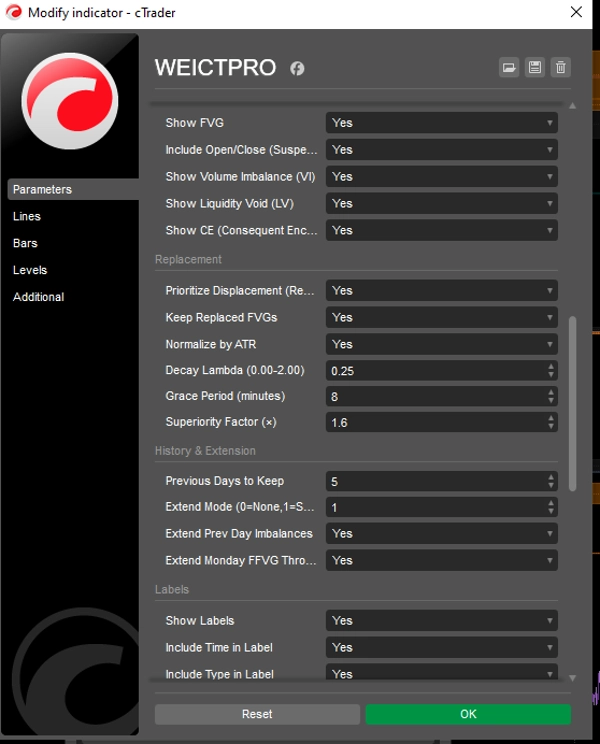
- Динамическое расширение: Коробки рисуются от точки происхождения и автоматически расширяются вперёд на заданное пользователем количество баров (
Extend Bars), чтобы показать потенциальную будущую поддержку/сопротивление. - Последующее вторжение (CE): Рисует пунктирную среднюю линию через дисбаланс. В теории ICT уровень 50% (CE) является критической институциональной точкой отсчёта.
- Автоматическая маркировка: Чётко отмечает каждую коробку названием сессии и типом дисбаланса (например, "NY AM +FVG").
Ключевые параметры
Параметр
Описание
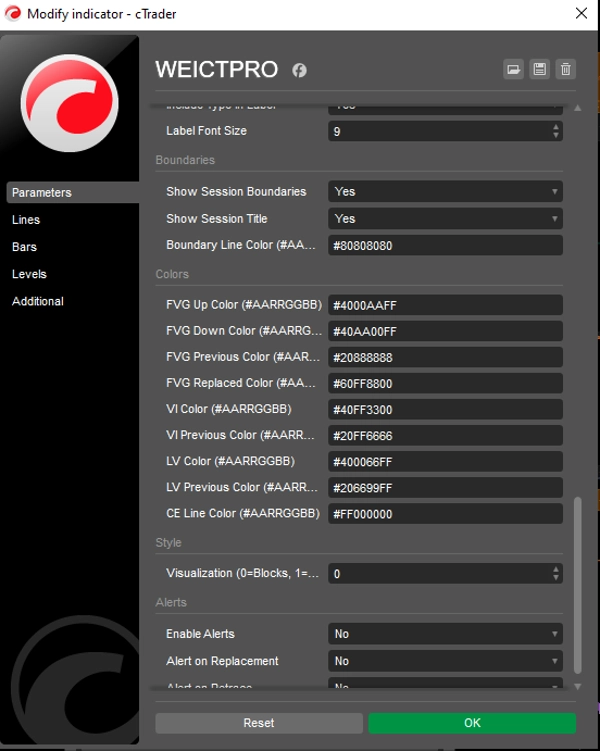
Показывать FVG/VI/LV
Переключение отслеживания конкретных типов дисбалансов.
Непрозрачность коробки
Регулирует, насколько "сплошными" выглядят затенённые области на вашем графике.
Extend Bars
На сколько свечей вперёд должна проецироваться коробка.
Часовой пояс
Жёстко задан на Восточное стандартное время для обеспечения точности сессий независимо от времени сервера вашего брокера.
Технические рекомендации
- Таймфреймы: Лучше всего использовать на M1 до M15. На более высоких таймфреймах (H1 и выше) сессии слишком коротки, чтобы надёжно зафиксировать "первый" представленный дисбаланс.
- Использование: Эти области часто действуют как "магниты" для цены. Трейдеры ищут возврат цены к этим коробкам (особенно к уровню CE) для входа перед продолжением в исходном направлении.
Сводка
The indicator detects three imbalance types: Fair Value Gap (FVG), a three-candle gap where the first and third candle wicks do not overlap; Volume Imbalance (VI), a gap between the bodies of two consecutive candles; and Liquidity Void (LV), a total price jump with no price action between consecutive candle wicks. Once an imbalance type is identified in a session, it locks and does not redraw until the next session.
Visual features include dynamically extending boxes from the imbalance origin for a user-defined number of bars, a dashed midline marking the 50% level (Consequent Encroachment), and automated labeling with session and imbalance type. The indicator is hardcoded to Eastern Time for session accuracy and is best used on M1 to M15 timeframes to reliably capture the first imbalance. Users can toggle imbalance types, adjust box opacity, and set extension length. This tool supports multiple markets including Forex, indices, commodities, stocks, and cryptocurrencies.