
Описание
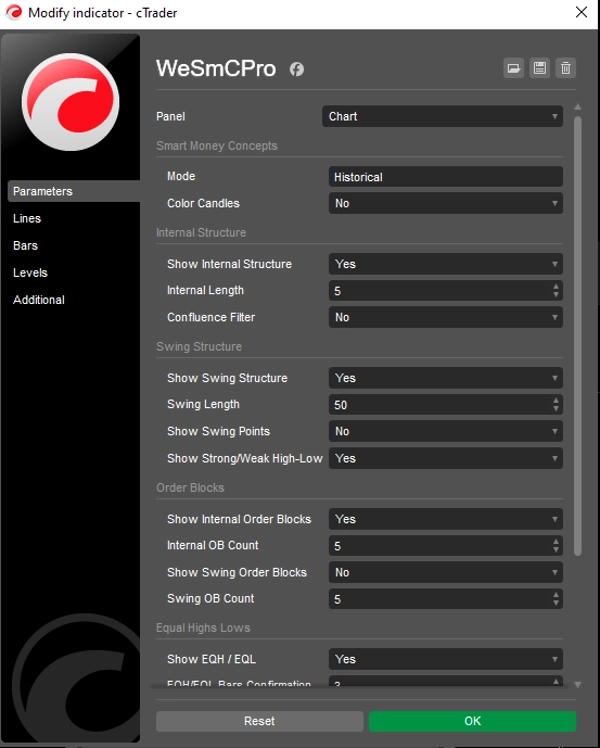
Этот список описывает расширенные настройки и функции индикатора Smart Money Concepts (SMC) для торговли. Он предназначен для автоматизации технического анализа структуры рынка, спроса/предложения и ликвидности.
Вот краткое и четкое описание того, что делают эти настройки:
🏗️ Структура рынка и ценовое действие
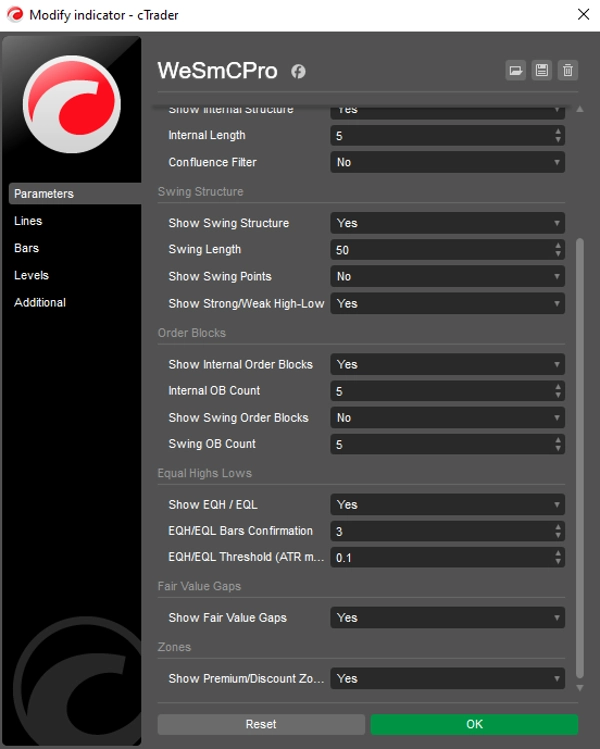
- Режим (Исторический/Текущий): Выбирайте между просмотром всех прошлых данных (бэктестинг) или только текущей живой структуры, чтобы не загромождать график.
- Внутренняя vs. Свинг-структура: * Внутренняя: Показывает "минорные" пробои (BOS/CHoCH) внутри тренда.
-
- Свинг: Показывает "мажорные" изменения тренда с помощью сплошных линий и больших меток.
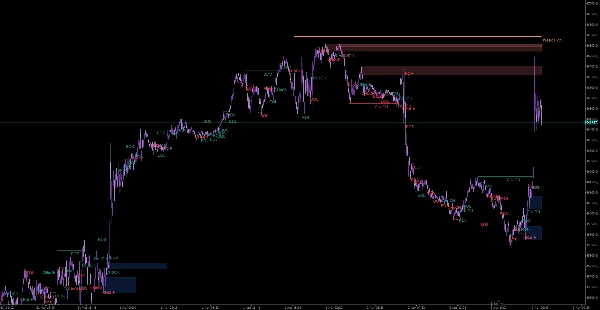
- Свинг-точки: Автоматически маркирует максимумы и минимумы (HH, HL, LH, LL), чтобы вам не приходилось определять тренд вручную.
- Равные максимумы и минимумы (EQH/EQL): Определяет потенциальные "розничные" уровни поддержки/сопротивления, где обычно находится институциональная ликвидность. Настройка Bars Confirmation фильтрует "ложные" равные максимумы/минимумы.
🧱 Спрос, предложение и дисбаланс
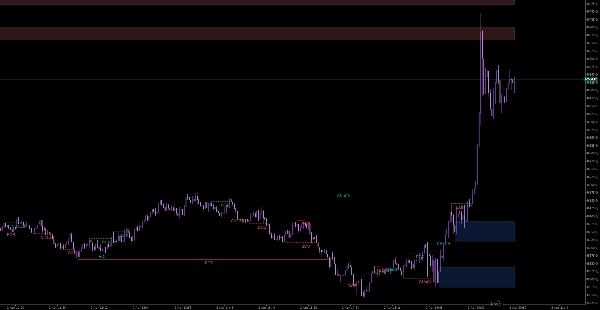
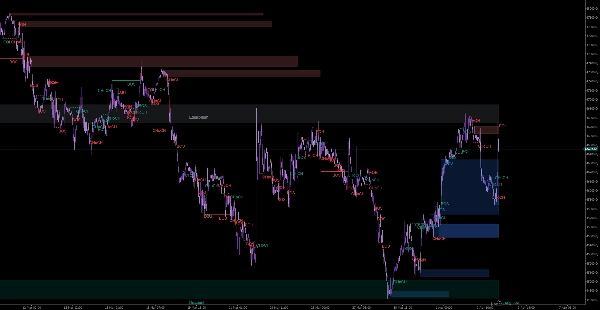
- Order Blocks (внутренние и свинг): Выделяет "последнюю свечу" перед крупным движением, где, вероятно, находятся отложенные ордера институциональных игроков. Вы можете ограничить количество отображаемых блоков, чтобы избежать "захламления".
- Fair Value Gaps (FVG): Выделяет ценовые дисбалансы (гэпы).
-
- Автоматический порог: Фильтрует маленькие, незначительные гэпы.
- Таймфрейм: Позволяет видеть FVG с более высокого таймфрейма, оставаясь на текущем графике.
- Расширение FVG: Проецирует гэп вперед, чтобы вы могли видеть, когда цена к нему вернется.
📊 Контекст и конвергенция
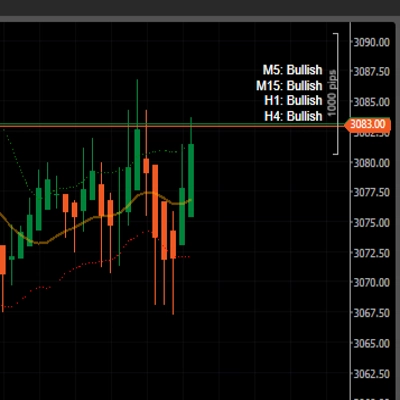
- Максимумы и минимумы MTF: Отображает предыдущие дневные, недельные и месячные максимумы/минимумы. Это "магнитные" уровни, на которых цена часто реагирует.
- Зоны премии/скидки: Делит торговый диапазон на три части:
-
- Премия: Цена дорогая (ищите продажи).
- Равновесие: Справедливая стоимость.
- Скидка: Цена дешевая (ищите покупки).
- Фильтр конвергенции: "Умный" переключатель, который скрывает слабые пробои структуры, показывая только движения с высокой динамикой или объемом.
Сводка
ИИ-сводка
WeSmCPro is a Smart Money Concepts (SMC) trading indicator designed to automate technical analysis by identifying market structure, supply and demand zones, and liquidity areas. It offers two modes: Historical for backtesting and Present for live market structure visualization. The indicator distinguishes between internal (minor) and swing (major) trend structures, automatically labeling swing points such as higher highs, higher lows, lower highs, and lower lows.
Key features include detection of equal highs and lows to identify potential retail support and resistance zones, with filters to reduce false signals. It highlights order blocks—candles preceding significant moves where institutional orders may rest—and fair value gaps (price imbalances), with options to filter insignificant gaps, view higher timeframe gaps on the current chart, and extend gaps forward for tracking price return.
For broader context, WeSmCPro plots multi-timeframe daily, weekly, and monthly highs and lows, which often act as price magnets. It divides trading ranges into premium (expensive), equilibrium (fair value), and discount (cheap) zones to assist in identifying potential sell or buy areas. A confluence filter helps focus on strong structure breaks supported by momentum or volume. The indicator supports various markets including Forex, cryptocurrencies, indices, commodities, and stocks.
Профиль индикатора
Отзывы покупателей
0.0
Отзывы: 0
Отзывы покупателей
У этого продукта еще нет отзывов. Уже попробовали его? Поделитесь впечатлениями!
Обсуждение
Частые вопросы
BTCUSD
Forex
Signal
Breakout
Indices
EURUSD
Commodities
GBPUSD
NZDUSD
Martingale
Prop
Scalping
SMC
Crypto
Grid
Stocks
AI
XAUUSD
NAS100
USDJPY
Продукты, доступные в cTrader Store, включая торговых ботов, индикаторы и плагины, предоставляются сторонними разработчиками и доступны исключительно в информационных и технических целях. cTrader Store не является брокером и не предоставляет инвестиционные консультации, персональные рекомендации или какие-либо гарантии будущей доходности.
Больше от этого автора


Цена
2.76K
Бесплатные установки