
Описание
MFI-MTF: Индекс денежного потока на нескольких таймфреймах
Обзор
MFI-MTF — это индикатор импульса на нескольких таймфреймах, который добавляет перспективу более высокого таймфрейма к вашему текущему графику. Рассчитывая индекс денежного потока (MFI) на более крупном таймфрейме и отображая его на вашем рабочем графике, этот индикатор помогает выявлять состояния перекупленности и перепроданности с разных рыночных точек зрения без необходимости вручную переключаться между таймфреймами.
Что он делает
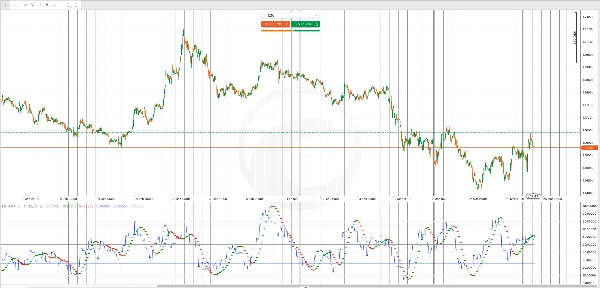
Анализ индекса денежного потока: Индикатор измеряет давление покупателей и продавцов, анализируя как движение цены, так и объем торгов. Он колеблется между 0 и 100, определяя, когда актив испытывает чрезмерное давление покупателей (перекупленность) или продавцов (перепроданность).
Контекст более высокого таймфрейма: Вместо расчета MFI на текущем таймфрейме графика, MFI-MTF берет данные с более высокого таймфрейма, который вы указываете (дневной, недельный, 4-часовой и т.д.). Это дает вам институциональные инсайты по импульсу без шума низших таймфреймов. Например, когда дневной MFI показывает перекупленность, вы понимаете, что крупный тренд близок к истощению — ценная информация для принятия решений о входе и выходе.
Фильтр скользящей средней Халла: Применение скользящей средней Халла (HMA) к MFI сглаживает ложные сигналы и выделяет изменения направленности импульса. Зеленые точки отмечают восходящие тренды импульса, а красные — нисходящие, обеспечивая быструю визуальную подтверждение изменений направления импульса.
Ключевые показатели
Линия MFI (синяя): Основное значение индекса денежного потока с выбранного вами более высокого таймфрейма, отображаемое на каждом баре текущего графика.
Сигналы HMA (зеленые/красные точки): Зеленые точки появляются при усилении импульса вверх; красные — при ослаблении или развороте импульса вниз. Они служат ранними предупреждениями о возможных разворотах.
Опорные уровни:
- Уровень перекупленности (по умолчанию 70): Когда MFI превышает этот уровень, давление покупателей чрезмерно, и вероятны развороты
- Уровень перепроданности (по умолчанию 30): Когда MFI опускается ниже этого уровня, давление продавцов исчерпано, и вероятны отскоки
- Средняя линия (50): Нейтральная точка равновесия между бычьим и медвежьим импульсом
Настройка
Выбор таймфрейма: Выберите любой таймфрейм выше текущего графика (например, дневной на часовом графике). Более крупные таймфреймы дают более широкий контекст тренда, но сигналы появляются реже; меньшие — больше торговых возможностей, но с меньшей стратегической перспективой.
Период MFI: Настройте период расчета индекса денежного потока (по умолчанию 14). Короткие периоды делают индикатор более чувствительным к последним изменениям объема; длинные сглаживают волатильность и уменьшают ложные сигналы.
Период HMA: Управляйте сглаживанием фильтра импульса. Короткие периоды делают изменения тренда более заметными, но шумными; длинные — надежнее подтверждают тренды, но сигналы появляются медленнее.
Пороги перекупленности/перепроданности: Настройте эти уровни в соответствии с вашим стилем торговли. Консервативные трейдеры могут использовать 75/25; агрессивные — 80/20, ожидая более экстремальных условий.
Практическое применение
Используйте MFI MTF для подтверждения ваших входов и выходов. Сигнал на продажу на вашем рабочем таймфрейме становится более надежным, если дневной MFI уже показывает перекупленность, указывая на активность институциональных продавцов. Аналогично, сигналы на покупку усиливаются, когда MFI на более высоком таймфрейме перепродан, показывая, что давление продавцов на макроуровне исчерпано.
Изменения цвета HMA дают вам оповещения в реальном времени о сдвигах импульса, помогая вовремя выходить из убыточных сделок или уменьшать размер позиции до серьезных разворотов.
Сводка
The indicator includes a Hull Moving Average (HMA) filter applied to the MFI to smooth out noise and highlight momentum shifts. Green dots indicate strengthening upward momentum, while red dots signal weakening or downward momentum. Reference levels include default overbought (70), oversold (30), and a neutral midpoint (50), all customizable to fit different trading styles.
Key outputs are the MFI line from the chosen higher timeframe and HMA signals for momentum direction changes. Adjustable parameters include the MFI lookback period, HMA smoothing period, and overbought/oversold thresholds. MFI-MTF aids in confirming entry and exit points by providing institutional-level momentum insights and real-time alerts to momentum shifts on your working chart.
Отзывы покупателей
5 | 100 % | |
4 | 0 % | |
3 | 0 % | |
2 | 0 % | |
1 | 0 % |


