Описание
▁▂▃▄▅▆▇ █ 10,000+ трейдеров (институциональных + розничных) █ ▇▆▅▄▃▂▁
- Выбирайте наши ТОП индикаторы в cTrader 🏆
- ✨ Эксклюзивная точность для превосходных результатов ✨
- 📈 Наши алгоритмы — с самыми высоко оценёнными визуализациями 🎯—
- успешно внедрены в 2 квантовых фонда
▁▂▃▄▅▆▇ █████████████████████████████ ▇▆▅▄▃▂▁
_______________________________________________
_______________________________________________
📌 Индикаторы структуры рынка
· ✅ AdvancedMarket Structure: Bos, Choch, SwinLevels, Order Blocks, Market Structure& Liquidity Finder
· 🔄 Dynamic Market StructureAnalysis of Turning Points
· 🧱 Order Block
· ⚖️ Market Imbalance
· ⛓️ BOS & CHOCH
· 🧠 ICT Power of 3
______________________________________________________________-
Магазин cBots : 🧠 Gold & BTC BreakoutSession Pivots 🧠
_______________________________________________
🔚 Системы умного выхода
_______________________________________________
📐 Индикаторы ZigZag
· 🔍 ZigZag Price LiquidityProjection
· ➖ ZigZag
_______________________________________________
🧱 Индикаторы поддержки и сопротивления
· 🟩 SmartTrend Support &Resistance Lines
· 🧱 All Support and ResistanceLevels
_______________________________________________
📊 Индикаторы тренда и каналов
· 📊 Supertrend
_______________________________________________
💧 Инструменты объёма и ликвидности
_______________________________________________
⚡ Индикаторы импульса и RSI
· 🔎 Multi-Level Candle BiasTracker
_______________________________________________
🔮 Инструменты прогнозирования и проекции
· 📐 Прогноз на основе Linreg& ATR
· 📏 Фибоначчи линейная регрессияМульти-таймфрейм
· 📈 Проектор рыночного потока на основе объёма
______________________________________________________________________________________________________
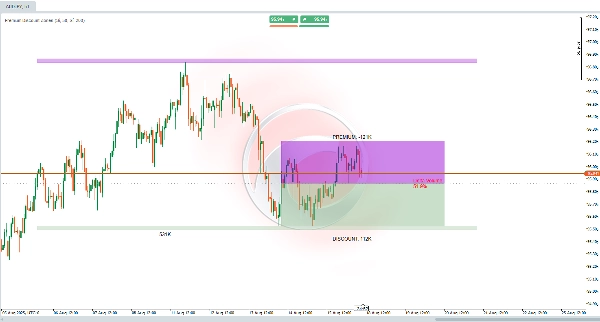
Что делает индикатор Premium Discount Zones? 🎯
Этот индикатор предназначен для помощи в идентификации ключевых зон на основе недавних максимумов и минимумов рынка. Он анализирует настраиваемый период прошлых баров для определения общего ценового диапазона, вычисляет среднюю точку равновесия, и делит этот диапазон на две основные зоны:
- 🔺 Премиум (Верхняя зона)
- 🟩 Скидка (Нижняя зона)
Он также оценивает торговый объём в этих барах для расчёта "дельты объёма", которая представляет процент объёма, связанного с медвежьими движениями.
Для чего это нужно? 💡
Этот индикатор помогает выявить зоны, где цена может быть:
- 📈 Переоценена (зона Премиум) → Возможность продажи или фиксации прибыли
- 📉 Недооценена (зона Скидки) → Возможность покупки или накопления
Он предоставляет быстрый обзор рыночных дисбалансов, показывая, поддерживает ли недавний объём бычьи или медвежьи движения. Расширенные структурные зоны проецируют ключевые уровни за пределы текущего диапазона, что полезно для планирования сделок в трендах или разворотах. 🚀
Идеально подходит для стратегий, ориентированных на диапазоны консолидации, прорывы, институциональную торговлю или анализ ликвидности!
Как интерпретировать? 🔍
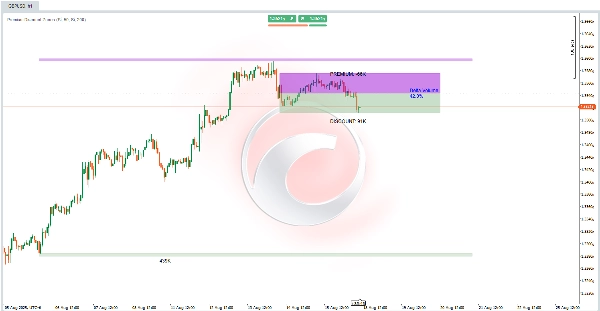
- 🟣 Зона Премиум (фиолетовая, выше равновесия) → Верхний диапазон, где цена считается "дорогой."
- 🟢 Зона Скидки (зелёная, ниже равновесия) → Нижний диапазон, где цена считается "дешёвой."
- ⚖️ Линия равновесия (серая, середина) → Отмечает середину диапазона, выступая уровнем баланса. Пересечение цены здесь может сигнализировать о смене настроения.
- 📊 Дельта объёма (центр) → Показывает процент медвежьего объёма (🔴 >50% = медвежий, 🔵 <50% = бычий).
- 🏛 Структурные зоны (затенённые расширения) → Расширенные области выше/ниже крайних значений диапазона, выступающие в роли долгосрочной поддержки/сопротивления с буфером, основанным на недавнем ценовом движении.
Индикатор динамически обновляет эти зоны на основе последних баров, расширяя их вправо для будущих проекций.
Как использовать в торговле? 🛠️
- Начальная настройка:
-
- Включите уровни PD (основные) и структурные зоны при необходимости.
- Настройте периоды обратного просмотра:
-
- Короткий (например, 50 баров) → Недавние диапазоны
- Длинный (например, 200 баров) → Структурный контекст
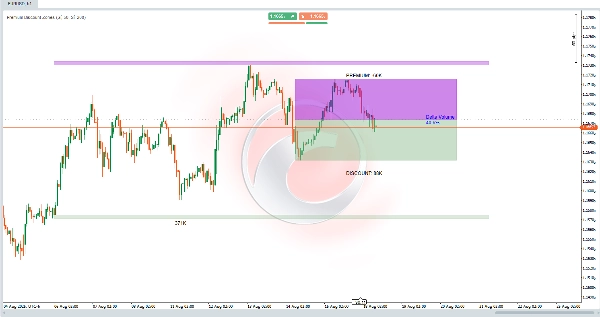
- Анализ графика (например, таймфрейм H1):
-
- Проверьте, находится ли цена в 🟣 Премиум (рассмотрите продажу при медвежьем подтверждении) или 🟢 Скидке (рассмотрите покупку при бычьем подтверждении).
- Используйте Дельту объёма для подтверждения:
-
- 🔴 >50% → Поддерживает шорты в Премиум
- 🔵 <50% → Поддерживает лонги в Скидке
- Стратегии входа и выхода:
-
- 🟢 Покупка в зоне Скидки: Если цена входит в зелёную зону и дельта низкая, ищите входы в лонг со стопами ниже минимума зоны и целями на уровне равновесия или Премиум.
- 🟣 Продажа в зоне Премиум: Если цена достигает фиолетовой зоны и дельта высокая, рассмотрите шорты со стопами выше максимума зоны и целями на уровне равновесия или Скидки.
- 🏛 Используйте структурные зоны для долгосрочных сделок, применяя буфер как запас ошибки.
Сводка
The indicator also computes a Volume Delta, representing the percentage of volume associated with bearish movements, which helps confirm market bias: values above 50% favor bearish conditions, while values below 50% favor bullish conditions. Extended structural zones project key support and resistance levels beyond the immediate range, useful for planning trades in trending or reversal markets.
Users can adjust lookback periods to focus on recent ranges or broader structural context. The indicator dynamically updates these zones and extends them forward for future projections. It supports trading strategies involving consolidation ranges, breakouts, institutional trading, and liquidity analysis by providing visual cues on price valuation and volume-driven market imbalances.