الوصف
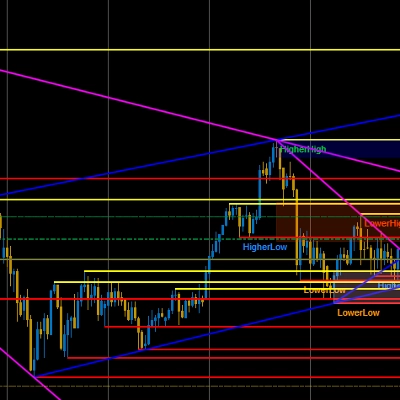
مستويات الدعم والمقاومة مع الاختراقات بواسطة [BeyondTrading] — شاهد كل مستوى مباشر وكل اختراق حقيقي. يكتشف تلقائيًا قمم وقيعان المحاور ويرسم خطوط الدعم والمقاومة الأفقية مباشرة على الرسم البياني. تمتد كل خط شريطًا بشريط في الوقت الحقيقي طالما أن المستوى ثابت. في اللحظة التي يغلق فيها السعر من خلاله، يتوقف الخط — بالضبط عند نقطة الاتصال. لا رسم يدوي، لا مستويات قديمة تملأ الرسم البياني الخاص بك.
عندما يتم كسر مستوى، يظهر إشارة فورًا: B لاختراق نظيف مع الحجم، Bull Wick أو Bear Wick عندما يكون الإغلاق مدفوعًا بشمعة ظل بدلاً من إغلاق جسم حقيقي. يقوم فلتر الحجم بإزالة التحركات منخفضة الاقتناع ويحتفظ فقط بالإشارات المهمة.
لماذا تهم مستويات الدعم/المقاومة مستويات الدعم والمقاومة ليست مجرد خطوط — إنها تجمعات سيولة. في كل مرة يرفض السعر مستوى ما، تتراكم أوامر الإيقاف والأوامر المعلقة فوقه وتحتها مباشرة. عندما يعود السعر، تأتي المؤسسات إما للدفاع عن المستوى أو لصيد أوامر الإيقاف الموجودة هناك قبل أن يبدأ التحرك الحقيقي. مستوى مقاومة تم اختباره ثلاث مرات ولم يُكسر أبدًا ليس عشوائيًا — إنه المكان الذي تتكدس فيه أوامر البيع وحيث سيتم حصر المتداولين في حالة اختراق زائف. معرفة أي المستويات لا تزال نشطة وأيها تم اختراقه بالفعل يخبرك بالضبط أين من المحتمل أن يحدث التفاعل التالي.
الميزات
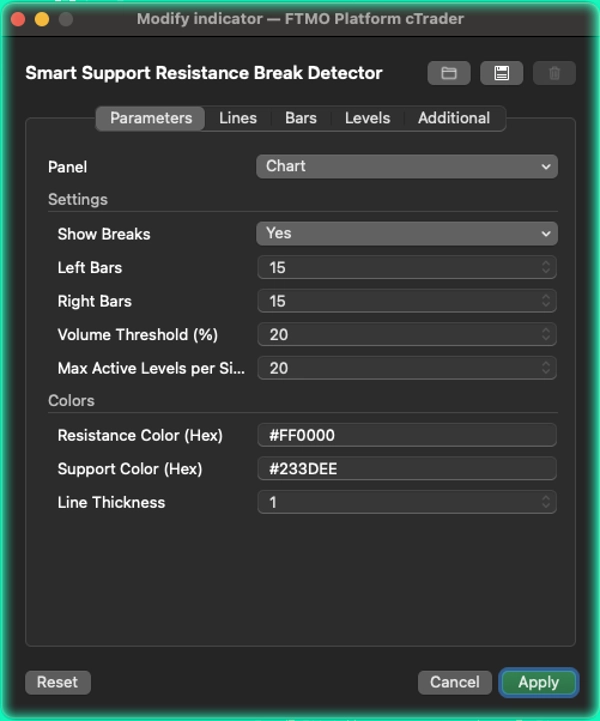
- كشف المحاور مع أشرطة يسرى ويمنى قابلة للتكوين لأي أسلوب تداول
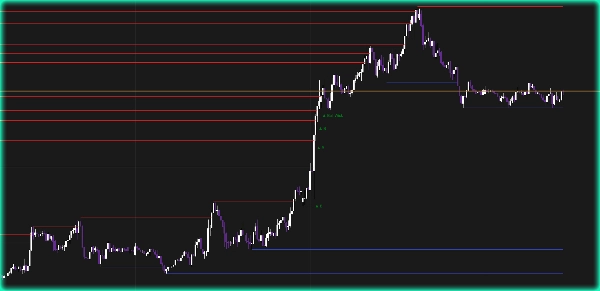
- تمتد الخطوط ديناميكيًا على كل شريط — تتوقف فور إغلاق السعر من خلالها
- فلتر الحجم (مذبذب EMA 5/10) لتمييز الاختراقات الحقيقية عن الضوضاء
- تسميات الاختراق: B للاختراقات النظيفة بالحجم، Bull Wick و Bear Wick للتحركات المدفوعة بالشموع الظلية
- تصفية التكرار — يتم تجاهل المستويات القريبة جدًا من المستويات الموجودة تلقائيًا
- أقصى عدد للمستويات النشطة لكل جانب للحفاظ على نظافة الرسم البياني وسهولة قراءته
- ألوان المقاومة والدعم قابلة للتكوين بالكامل مع إدخال هكس
الملخص
The indicator features volume-confirmed break signals to distinguish genuine breakouts from low-conviction moves. It displays specific labels: "B" for clean volume breaks, and "Bull Wick" or "Bear Wick" when breaks are driven by wicks rather than body closes. A volume filter based on EMA oscillators helps filter out noise.
Additional functionalities include configurable pivot detection parameters (Left Bars and Right Bars), automatic filtering of duplicate levels, and limits on the maximum number of active levels per side to maintain chart clarity. Users can customize support and resistance line colors using hex codes.
This tool is designed to highlight key liquidity pools where institutional orders accumulate, aiding traders in identifying active levels and potential reaction points in the market.