
الوصف
🚀 أكثر من 10,000 متداول يستخدمون بالفعل مؤشراتنا TOP🏆
اكتشف لماذا يختارنا المحترفون – أقوى الأدوات على cTrader (المؤشرات، الخوارزميات، وcBots) في انتظارك.
👉 احصل على جميع أنظمتنا TOP هنا:
_______________________________________________
_______________________________________________
📌 مؤشرات هيكل السوق
· ✅ هيكل السوق المتقدم: Bos, Choch, SwinLevels, كتل الأوامر، هيكل السوقوآداة العثور على السيولة
· 🔄 تحليل هيكل السوق الديناميكي لنقاط التحول
· 🧱 كتلة الأمر
· ⚖️ اختلال السوق
· ⛓️ BOS & CHOCH
· 🧠 ICT قوة 3
______________________________________________________________-
متجر cBots : 🧠 اختراق الذهب وBTCمحاور الجلسة 🧠
_______________________________________________
🔚 أنظمة الخروج الذكية
_______________________________________________
📐 مؤشرات ZigZag
· 🧭 S&R هيكل ZigZag
· ➖ ZigZag
_______________________________________________
🧱 مؤشرات الدعم والمقاومة
· 🟩 خطوط دعم ومقاومة SmartTrend
· 🧱 جميع مستويات الدعم والمقاومة
_______________________________________________
📊 مؤشرات الاتجاه والقناة
· 📊 سوبرتريند
· ⭐ قناة SSL المميزة
_______________________________________________
💧 أدوات الحجم والسيولة
· 📉 خريطة تصفية الرافعة المالية
_______________________________________________
⚡ مؤشرات الزخم وRSI
· 📈 مُشغل اتجاه RSI
· 🔎 متعقب ميل الشمعة متعدد المستويات
_______________________________________________
🔮 أدوات التنبؤ والإسقاط
· 📐 التنبؤ بناءً على Linreg& ATR
· 📏 انحدار فيبوناتشي الخطي متعدد الأطر الزمنية
· 📈 عارض تدفق السوق المدعوم بالحجم
_________________________________________________________________________________
_________________________________________________________________________________
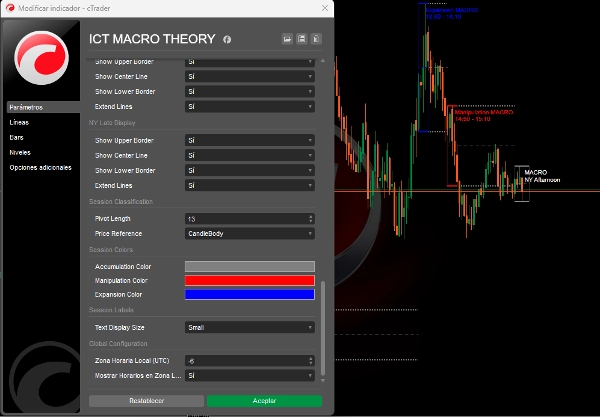
🌐 نظرية ICT ماكرو
⚠️ ملاحظة مهمة: هذا المؤشر يعمل فقط على الأطر الزمنية أقل من 5 دقائق.
شرح فترات ICT ماكرو
فترات ICT ماكرو هي في الأساس فترات قصيرة يبحث خلالها الخوارزم عن السيولة أو يعدل السعر لفجوات القيمة العادلة. أساس هذه الماكروز يكمن في نظرية الوقت والسعر لـ ICT.
الماكرو هو "سلسلة قصيرة من التعليمات التي تخلق حدثًا في تسليم السعر"، كما عرفها ICT نفسه.
ماكروز ICT ليست استراتيجيات تداول كاملة، لكنها يمكن أن تضيف توافقًا لصفقاتك وتزيد الأرباح. تحدث خلال جلسات لندن، نيويورك، الظهيرة، وبعد الظهر.
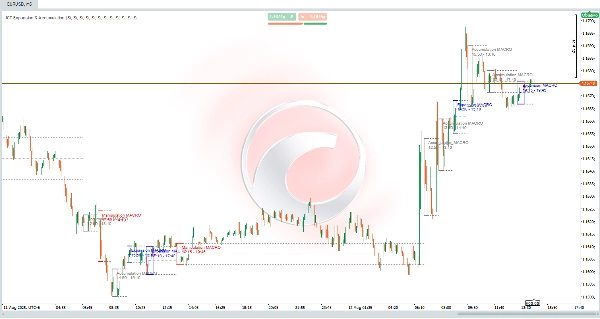
🔮 التنفيذ المتقدم لنظرية أوقات ICT ماكرو:
الاتصال المباشر بمفاهيم ICT:
الكود ينفذ بالضبط الأنواع الثلاثة من ماكروز ICT الموضحة في النظرية، باستخدام منطق التصنيف بناءً على:
- تحليل هيكل السوق:
-
- كشف جلسات الماكرو
- يسجل أوقات ICT الدقيقة (لندن 02:33، نيويورك 09:50، إلخ).
- يكشف التغيرات الهيكلية قبل وأثناء كل جلسة ماكرو.
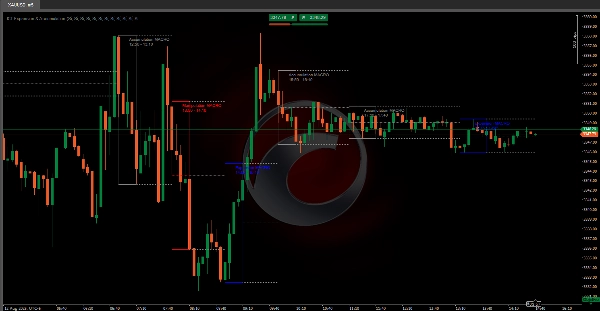
- يصنف تلقائيًا إلى:
-
- 🟥 التلاعب: عندما يجتاح السعر السيولة على الجانبين (شراء/بيع).
- 🟦 التوسع: تحركات اتجاهية تأخذ السيولة من جانب واحد (متماشية مع الاتجاه).
- 🟩 التراكم: نطاق ضيق حيث "يتراكم" السعر السيولة.
- المستويات الرئيسية الممتدة:
-
- يرسم القمم والقيعان لكل جلسة ماكرو.
- يحسب ويمتد السعر المتوسط (النقطة الوسطى) للجلسة التالية.
- تعمل هذه المستويات كدعم/مقاومة ديناميكي (أساسي في ICT!).
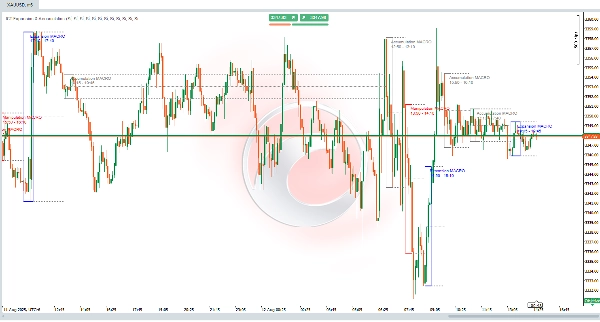
- كشف السيولة في الوقت الحقيقي:
-
- يستخدم بيانات دقيقة واحدة لتحديد المحاور الدقيقة (نفس ما يُرى على الأطر الزمنية الأقل).
التحسينات والتحديثات القادمة:
- كشف اجتياحات السيولة: سيحدد اجتياحات السيولة السابقة (القمم/القيعان السابقة لليوم/الأسبوع).
- فجوات القيمة العادلة (FVG): سيكشف ويصور فجوات القيمة العادلة.
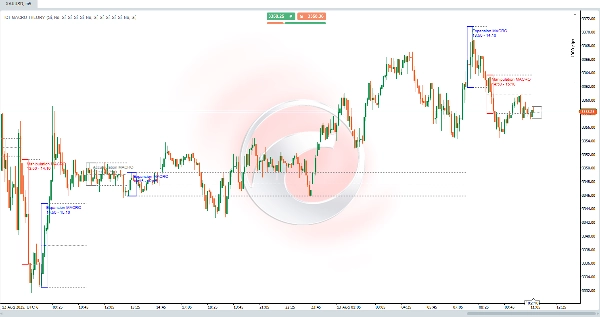
📊 مثال عملي على ICT
سيناريو افتتاح نيويورك (09:50-10:10):
- قبل الجلسة: السعر يجتاح سيولة جانب الشراء (أدنى محلي).
- أثناء الجلسة:
-
- مصنف كـ 🟥 تلاعب.
- ينتقل السعر إلى هيكل هبوطي.
- بعد الجلسة:
-
- خطوط ممتدة تحدد المقاومة عند قمم الجلسة.
- رفض الصفقة عند المنطقة مع نسبة مخاطرة إلى ربح 1:3.
✅ مخلص لمبدأ ICT:
"الماكروز ليست استراتيجيات كاملة لكنها تضيف توافقًا من خلال تحديد الأماكن التي ستبحث فيها الخوارزميات عن السيولة."
الملخص
The indicator analyzes market structure and detects key macro sessions—London, New York, midday, and afternoon—recording exact ICT times. It classifies price behavior into three types of macros: Manipulation (price sweeps liquidity on both sides), Expansion (directional movement aligned with trend), and Accumulation (tight range where price accumulates liquidity). It also draws and extends session highs, lows, and average price levels to act as dynamic support and resistance.
Using 1-minute data, ICT MACRO THEORY detects precise pivots for real-time liquidity identification. While not a complete trading strategy, it adds confluence to trades by highlighting where algorithms seek liquidity. Planned updates include detection of liquidity sweeps and visualization of fair value gaps.
This tool is intended for traders seeking to incorporate ICT macro time concepts into their analysis for enhanced market structure insight and liquidity detection on very short timeframes.


![شعار "[Stellar Strategies] Smart ADX"](https://cdn.ctrader.com/image/webp/af13b084-b6f6-41db-b7bc-c7e688b57b05_36929)


![شعار "Trend Angle Indicator [Iridio Capital]"](https://cdn.ctrader.com/image/webp/28a98496-3412-4fea-82eb-be3347bdd6f1_27612)


