
الوصف
مؤشر التحليل الفني هو حل متقدم للتحليل الفني تم تطويره لمنصة cAlgo، يدمج عدة مؤشرات فنية تركز على تحديد الاتجاهات القوية، زخم السوق، وتأكيد الحجم. يجمع بين ADX (مؤشر الاتجاه المتوسط) مع تحليل الميل، تصفية الحجم، والتحليل الفني متعدد المؤشرات في الوقت الحقيقي، مما يوفر للمتداولين رؤية شاملة وموثوقة لاتخاذ القرار.
🔍 الاستراتيجية الرئيسية
1. الأساس: ADX + DI (نظام الحركة الاتجاهية)
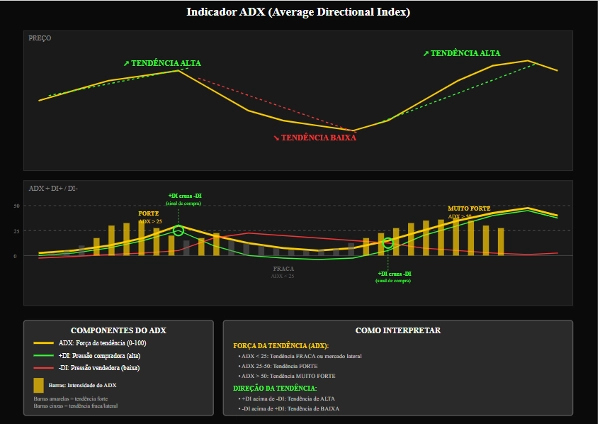
جوهر المؤشر هو ADX (مؤشر الاتجاه المتوسط)، الذي يقيس قوة الاتجاه.
مكونات +DI (مؤشر الاتجاه الإيجابي) و -DI (مؤشر الاتجاه السلبي) تحدد اتجاه الاتجاه:
+DI > -DI → اتجاه صاعد
-DI > +DI → اتجاه هابط
2. تحليل الزخم الديناميكي مع الميل
يتم حساب ميل ADX، +DI، و -DI باستخدام الانحدار الخطي.
هذا يسمح بتحديد ما إذا كان الاتجاه:
يكتسب قوة (ميل إيجابي)
يفقد القوة (ميل سلبي)
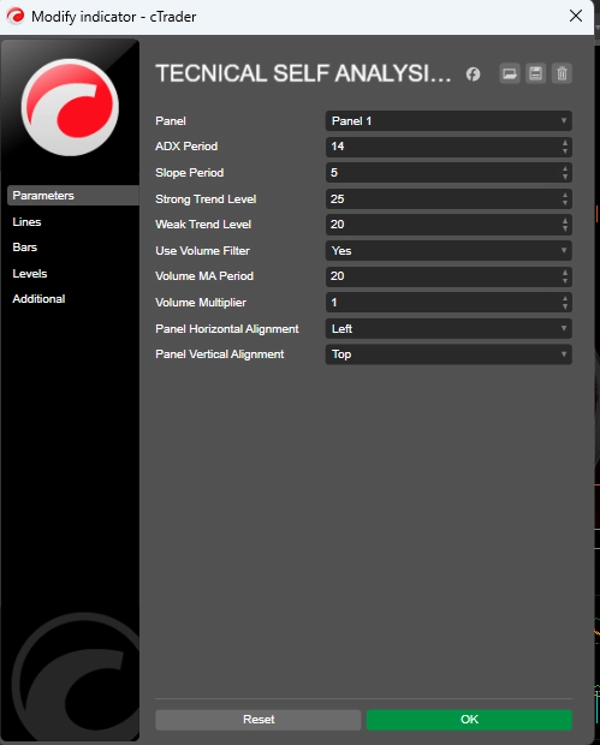
3. مستويات المرجع
مستوى الاتجاه القوي: المستوى الذي يعتبر فوقه الاتجاه قويًا (الافتراضي: 25)
مستوى الاتجاه الضعيف: الحد الأدنى للنظر في اتجاه صالح (الافتراضي: 20)
الاتجاهات التي تقل عن المستوى الضعيف تُعامل كاتجاه جانبي أو بدون اتجاه واضح.
📈 توليد الإشارات
شروط الشراء
✅ تقاطع +DI فوق -DI
✅ ADX فوق مستوى الاتجاه الضعيف (مستوى الاتجاه الضعيف)
✅ ميل إيجابي لـ ADX و +DI
✅ تأكيد الحجم (اختياري)
شروط البيع
✅ تقاطع -DI فوق +DI
✅ ADX فوق مستوى الاتجاه الضعيف (مستوى الاتجاه الضعيف)
✅ ميل إيجابي لـ ADX و -DI
✅ تأكيد الحجم (اختياري)
إشارات قوية: عندما يكون ADX فوق مستوى الاتجاه القوي والميل إيجابي بشكل كبير، يولد المؤشر إشارات معززة، متجنبًا الإدخالات المتكررة المتتالية. 📊 فلتر الحجم (اختياري)
قد يتطلب المؤشر تأكيد الحجم قبل توليد الإشارات.
يجب أن يكون الحجم الحالي أكبر من أو يساوي المتوسط المتحرك للحجم × المضاعف.
هذا يساعد في تصفية الاختراقات والإشارات الخاطئة في الأسواق غير السائلة.
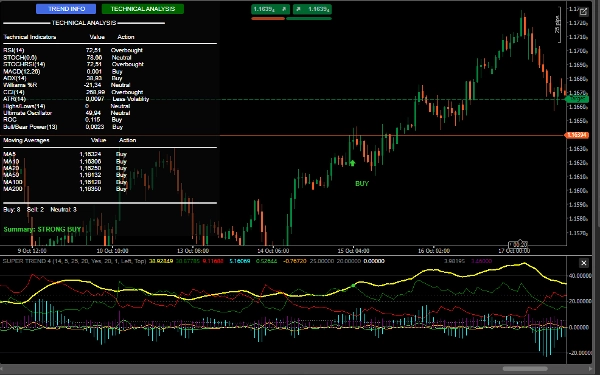
🧠 التحليل الفني المتقدم (لوحة تفاعلية)
يتضمن التحليل الفني لوحتين تفاعليتين على الرسم البياني:
1. معلومات الاتجاه
نوع الاتجاه: صاعد / هابط / جانبي
قوة الاتجاه: قوي / ضعيف
الزخم: تقوية / ضعف / مستقر
قيم ADX الحالية، +DI، -DI والميل
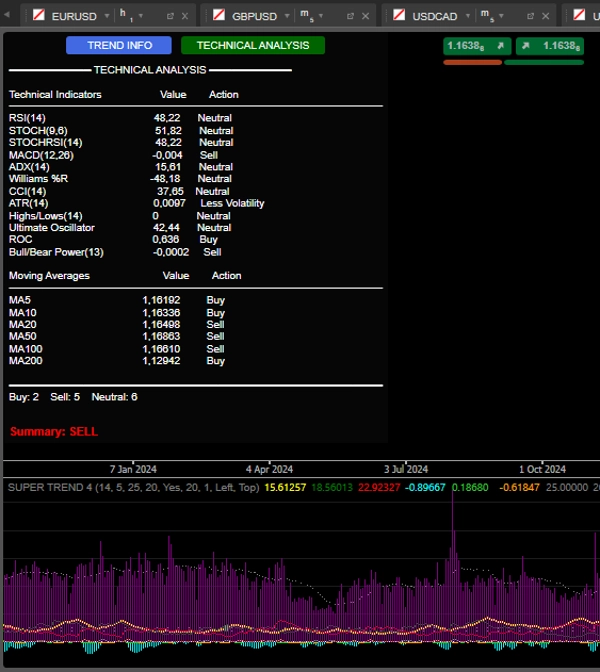
2. التحليل الفني
يقوم بتحليل متعدد المؤشرات في الوقت الحقيقي، بما في ذلك:
RSI(14) – تشبع الشراء/البيع
Stochastic(14) – الزخم
MACD(12,26) – التقاطعات والانحرافات
Williams %R – أقصى السوق
CCI(14) – الانحرافات عن السعر النموذجي
ROC(12) – معدل التغير
Ultimate Oscillator – تأكيد القوة
Bull/Bear Power – ضغط الشراء/البيع
المتوسطات المتحركة (5,10,20,50,100,200) – الاتجاه طويل الأمد
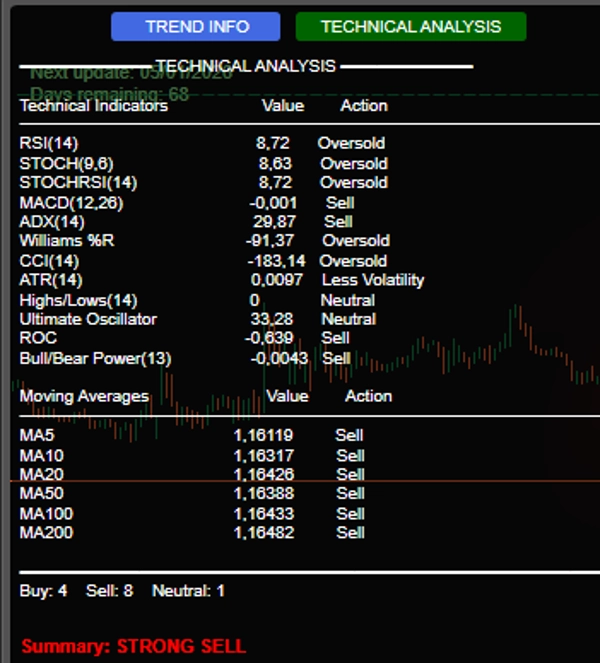
الملخص النهائي: يحصي النظام إشارات الشراء/البيع/الحيادية ويصدر توصية واضحة:
شراء قوي (≥7 إشارات شراء)
شراء
بيع
بيع قوي (≥7 إشارات بيع)
محايد
🔔 التنبيهات والتصور
إشارات بصرية على الرسم البياني:
سهام خضراء/حمراء مع تسميات "شراء"/"بيع"
إشعارات صوتية (ويندوز)
سجلات مفصلة في وحدة التحكم مع:
وقت الإشارة
قيم ADX، DI والحجم (إذا تم التفعيل)
🛡️ المزايا التنافسية
✅ دمج مؤشرات متعددة في لوحة واحدة
✅ التركيز على قوة واتجاه الاتجاه (ليس فقط السعر)
✅ فلتر الحجم لمزيد من الموثوقية
✅ واجهة تفاعلية ومعلوماتية
✅ إشارات واضحة مع تنبيهات بصرية وصوتية
هذه نسخة تجريبية.


![شعار "[Hamster-Coder] Pivot Points (Demo)"](https://cdn.ctrader.com/image/webp/87b54299-8c73-4942-9207-4bc6db824811_31153)


