
Area of Interest
Chỉ báo
2 lượt mua
Phiên bản 1.0, Aug 2025
Windows, Mac
4.0
Đánh giá: 2
Kể từ 29/05/2025
3.04M
Khối lượng đã giao dịch
45.22K
Pip đạt được
29
Lượt bán
769
Cài đặt miễn phí
Mô tả
1. Mục đích của Chỉ báo
Chỉ báo Khu vực Quan tâm của cTrader xác định vùng hỗ trợ và vùng kháng cự trong khoảng thời gian nhìn lại do người dùng định nghĩa, và làm nổi bật chúng dưới dạng “Khu vực Quan tâm” trên biểu đồ của bạn.
Nó giúp các nhà giao dịch nhanh chóng nhìn thấy các mức giá chính nơi khả năng đảo chiều hoặc phá vỡ cao hơn.
2. Cách hoạt động của Mã
- Khoảng thời gian nhìn lại – Số lượng thanh (nến) trước đó mà chỉ báo sẽ quét để tìm mức cao nhất và thấp nhất.
- Giá trị cao hơn → vùng rộng hơn.
- Giá trị thấp hơn → các mức gần đây hơn.
- Chiều cao vùng – Kích thước chiều dọc (độ dày) của khu vực hỗ trợ/kháng cự tính bằng pip.
- Giúp làm cho vùng dễ nhìn thấy và điều chỉnh hơn.
- Xóa các bản vẽ cũ trước khi vẽ bản mới để tránh lộn xộn.
- Thu thập giá cao và thấp cho phạm vi nhìn lại.
- Tìm các mức giá cao nhất và thấp nhất (kháng cự & hỗ trợ).
- Chuyển đổi chiều cao vùng từ pip sang giá trị thực tế.
3. Hướng dẫn sử dụng
- Gắn Chỉ báo
-
- Mở cTrader, tải biểu đồ, nhấp Indicators → Custom → AreaOfInterest.
- Điều chỉnh Tham số
-
- Khoảng thời gian nhìn lại:
-
- Đối với giao dịch swing → Sử dụng giá trị lớn hơn (ví dụ: 100–200).
- Đối với giao dịch lướt sóng → Sử dụng giá trị nhỏ hơn (ví dụ: 20–50).
- Chiều cao vùng: Điều chỉnh theo phong cách giao dịch và biến động của công cụ.
- Diễn giải các Vùng
-
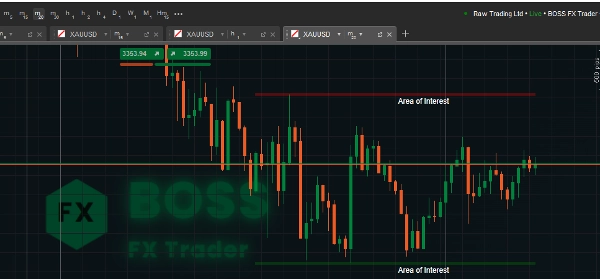
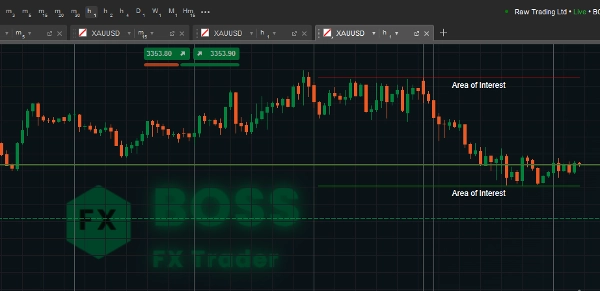
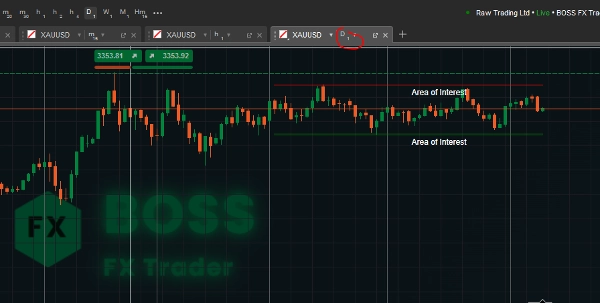
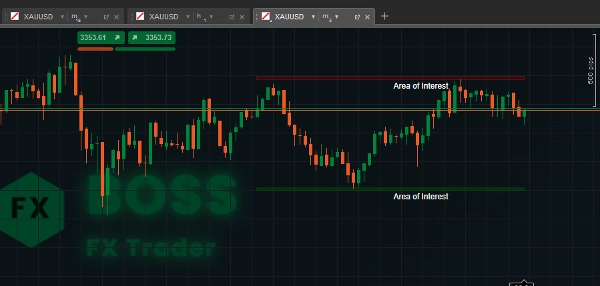
- Vùng Đỏ (Kháng cự) – Giá có xu hướng đảo chiều hoặc chậm lại khi vào vùng này.
- Vùng Xanh (Hỗ trợ) – Giá thường bật lên từ đây.
- Tìm kiếm:
-
- Sự từ chối giá
- Mẫu nến (pin bars, engulfing)
- Sự hội tụ với các chỉ báo khác (EMA, RSI, Fibonacci)
- Ví dụ Giao dịch
-
- Giao dịch Bật lại: Vào lệnh mua gần vùng xanh với điểm dừng ngay dưới đó.
- Giao dịch Phá vỡ: Chờ giá đóng cửa trên vùng đỏ để xác nhận phá vỡ tăng.
- Phát hiện Phá vỡ giả: Quan sát các bóng nến vượt ra ngoài vùng nhưng đóng cửa bên trong (có thể đảo chiều).
Một nhà giao dịch có lợi nhuận đã sử dụng công cụ này.
Tóm tắt
Tóm tắt AI
Area of Interest is a cTrader indicator designed to identify and visually highlight key support and resistance zones on trading charts. It scans a user-defined lookback period to detect the highest highs and lowest lows, marking these as “Areas of Interest” to help traders recognize price levels where reversals or breakouts are more likely. Users can adjust the lookback period to focus on broader historical zones or more recent price levels, and set the vertical size (zone height) of these areas in pips for better visibility. The indicator clears previous drawings before plotting new zones to maintain chart clarity. Resistance zones are displayed in red, indicating potential price reversals or slowdowns, while support zones appear in green, suggesting possible price bounces. Traders can use these zones alongside price action signals such as candlestick patterns and other technical indicators to inform trading decisions. Typical applications include entering long positions near support zones, trading breakouts above resistance zones, and detecting false breakouts by observing price wicks relative to the zones. The indicator supports customization to suit different trading styles, including scalping and swing trading, by adjusting the lookback period and zone height parameters.
Hồ sơ chỉ báo
Đánh giá của khách hàng
4.0
Đánh giá: 2
5 | 0 % | |
4 | 100 % | |
3 | 0 % | |
2 | 0 % | |
1 | 0 % |
Thảo luận
Câu hỏi thường gặp
Các sản phẩm có sẵn trên cTrader Store, bao gồm bot giao dịch, chỉ báo và plugin, được cung cấp bởi các nhà phát triển bên thứ ba và chỉ nhằm mục đích cung cấp thông tin và tiếp cận kỹ thuật. cTrader Store không phải là nhà môi giới và không cung cấp lời khuyên đầu tư, khuyến nghị cá nhân hay bất kỳ đảm bảo nào về hiệu suất trong tương lai.


Giá
Kể từ 29/05/2025
3.04M
Khối lượng đã giao dịch
45.22K
Pip đạt được
29
Lượt bán
769
Cài đặt miễn phí