

الوصف
آلة حاسبة للفارق هي أداة تُستخدم لحساب الفرق بين سعرين أو قيمتين، وغالبًا ما تُستخدم في السياقات المالية في التداول. يمكنها المساعدة في تحديد الأرباح المحتملة، والخسائر، ونقاط التعادل، بالإضافة إلى تقدير الاحتمالات والخطوط العادلة في سيناريوهات التداول.
لماذا تستخدم هذا المؤشر؟
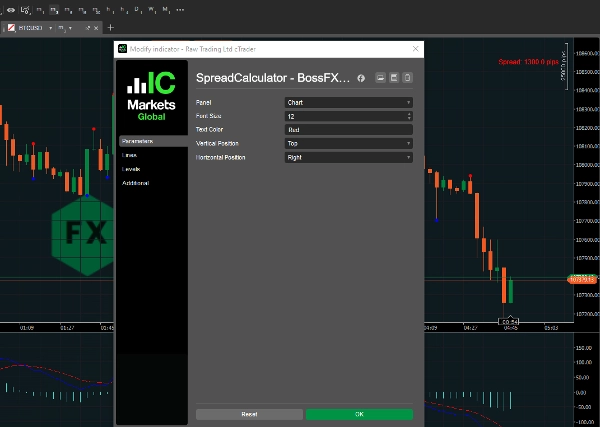
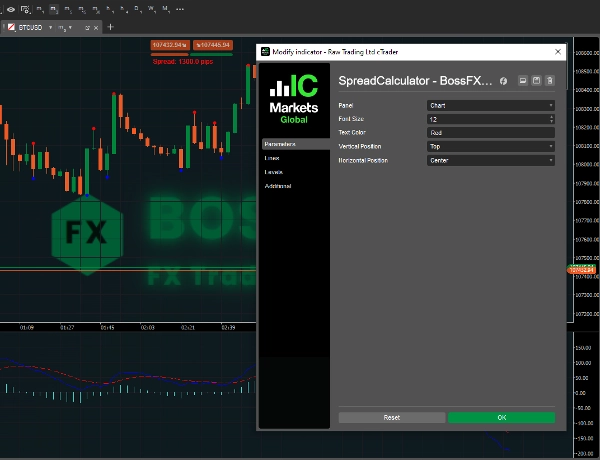
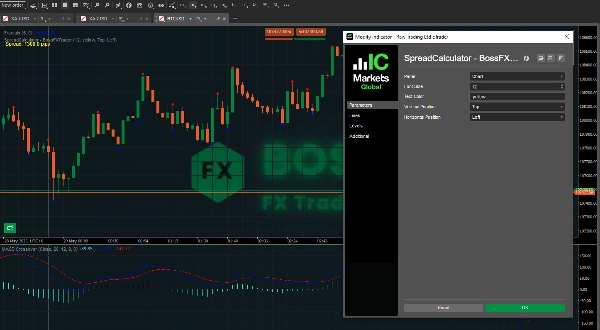
- التداول بدقة: اعرف بالضبط الفارق الزمني الحقيقي لكل زوج عملات أو سهم.
- أنماط المواضع القابلة للتحكم: حجم الخط، لون النص، الموضع الرأسي والأفقي.
إليك لماذا استخدام آلة حاسبة للفارق مفيد:
- فهم تكاليف التداول:
الفارق هو تكلفة أساسية للتداول، وتساعدك الآلة الحاسبة على تصور هذه التكلفة عند الدخول أو الخروج من صفقة.
- تحسين الاستراتيجيات:
من خلال تحليل الفوارق التاريخية، يمكنك تحسين استراتيجيات التداول وتقليل تكاليف التداول الإجمالية الخاصة بك.
- اتخاذ قرارات مستنيرة:
توفر الآلة الحاسبة بيانات عن الفارق، مما يتيح لك اتخاذ قرارات تداول مستنيرة ومستعدة.
- حساب متطلبات الهامش:
في المراهنة على الفارق، يمكن لآلة حاسبة الفارق مساعدتك في تحديد الهامش المطلوب لصفقتك، وهو مقدار رأس المال الذي تحتاج إلى وجوده في حسابك.
- تقييم الربح/الخسارة المحتملة:
يمكن للآلة الحاسبة أيضًا تقدير ربحك أو خسارتك المحتملة بناءً على الفارق الحالي وحجم تداولك.
- مقارنة الوسطاء:
يمكنك استخدام آلة حاسبة للفارق لمقارنة الفوارق التي يقدمها وسطاء مختلفون واختيار الذي يوفر أفضل الأسعار لاحتياجات تداولك.
- تحليل استراتيجيات الخيارات:
في تداول الخيارات، يمكن لآلات حاسبة الفارق مساعدتك في تحليل استراتيجيات الفارق العمودي المختلفة (مثل الفوارق الصاعدة/الهابطة).
- فهم أسعار العرض والطلب:
الفارق هو الفرق بين سعر العرض (ما يرغب البائع في البيع به) وسعر الطلب (ما يرغب المشتري في الشراء به).
الملخص
تقييمات العملاء
5 | 50 % | |
4 | 50 % | |
3 | 0 % | |
2 | 0 % | |
1 | 0 % |


