
Market Sessions
مؤشر
748 التنزيلات
الإصدار 1.0، Aug 2025
Windows, Mac
الوصف
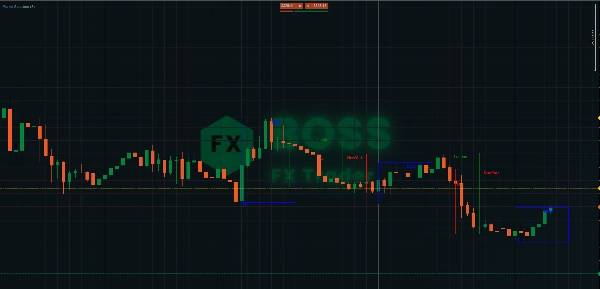
جلسات السوق مهمة جدًا للمتداولين، خاصة في الفوركس، لأن السوق مفتوح على مدار 24 ساعة لكن النشاط غير موزع بالتساوي. إليك سبب أهمية الجلسات:
- جلسات مختلفة = تقلبات مختلفة
- توقيت السيولة
- استراتيجيات تعتمد على الجلسة
- تجنب التحركات الوهمية
- مطابقة نمط الحياة الشخصية
✅ باختصار: توجه جلسات السوق المتداولين بشأن متى يتاجرون، وأي الأزواج يتاجرون بها، وأي أسلوب يستخدمون. إنها العمود الفقري لتوقيت استراتيجيات التداول.
اطلع على منتجاتنا الأخرى على https://ctrader.com/account/products?u=BossFXTrader
الملخص
ملخص الذكاء الاصطناعي
Market Sessions is an indicator designed for traders, particularly in the Forex market, where trading occurs 24 hours but with varying activity levels. It highlights the different market sessions, each characterized by distinct volatility and liquidity patterns. By identifying these sessions, the indicator helps traders determine optimal trading times, select suitable currency pairs, and adapt trading styles accordingly. Key functionalities include guiding users on when to trade, understanding liquidity timing, applying session-based strategies, avoiding false market moves, and aligning trading schedules with personal lifestyles. This tool supports more informed decision-making by emphasizing the importance of market timing in trading strategies.
ملف تعريف المؤشر
تقييمات العملاء
0.0
التقييمات: 0
تقييمات العملاء
لا توجد تقييمات لهذا المنتج حتى الآن. هل جرَّبته بالفعل؟ كن أول من يخبر الآخرين!
مناقشة
الأسئلة الشائعة
يتم توفير المنتجات المتاحة من خلال cTrader Store، بما في ذلك روبوتات التداول والمؤشرات والإضافات، من قبل مطوري الطرف الثالث وإتاحتها لأغراض الوصول المعلوماتي والفني فقط. cTrader Store ليس وسيطًا ولا يقدم نصائح استثمارية أو توصيات شخصية أو أي ضمان للأداء المستقبلي.


![شعار "[Hamster-Coder] Pivot Points (Demo)"](https://cdn.ctrader.com/image/webp/87b54299-8c73-4942-9207-4bc6db824811_31153)

السعر
منذ 29/05/2025
3.03M
حجم التداول
45.22K
الربح بالبيب
28
المبيعات
748
التثبيتات المجانية