EKVWAP
Индикатор
2.57K скачивания
Версия 1.0, Jan 2025
Windows, Mac
4.3
Отзывы: 6
Описание
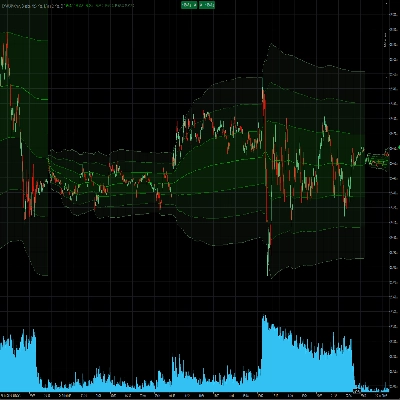
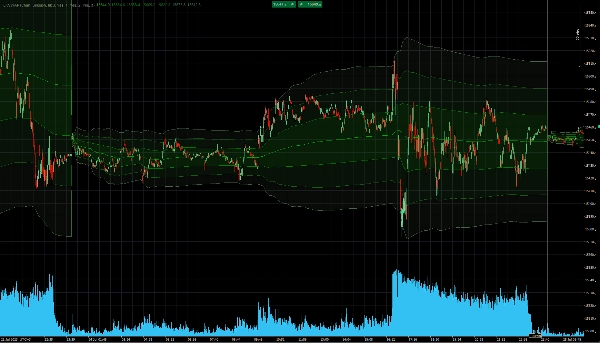
Это продвинутый индикатор VWAP, который позволяет настраивать все его аспекты.
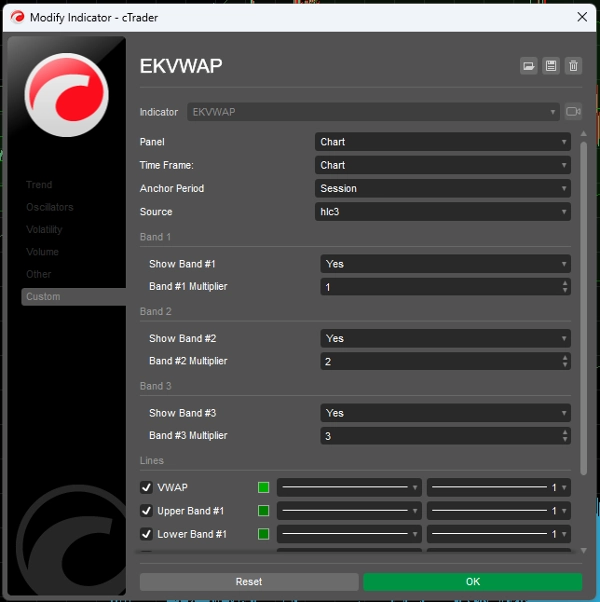
Вы можете задать якорь VWAP:
- К ручной точке якоря.
- По сессии в случае рынков с несколькими сессиями в один день (например, HK50 или AUS200),
- По дню
- По неделе
Поддерживается отображение до 3 полос стандартного отклонения. Вы можете задать индивидуальные цвета для каждой полосы, а также установить их множители или просто скрыть/показать их.
Ручная точка якоря:
После того как вы кликнете на бар на графике, нажмите клавиши Alt-A (настраивается в опциях), чтобы установить ручную точку якоря для расчёта VWAP. Расчёт начнётся с той точки, на которой вы находились при нажатии клавиш Alt-A. Повторное нажатие Alt-A выйдет из ручного расчёта VWAP и вернёт к предыдущему.
Сводка
ИИ-сводка
EKVWAP is an advanced Volume Weighted Average Price (VWAP) indicator designed for customizable technical analysis. It allows users to anchor the VWAP calculation to various points, including a manual anchor set directly on the chart, by trading session (useful for markets with multiple daily sessions such as HK50 or AUS200), by day, or by week. The indicator supports the display of up to three standard deviation bands, each with configurable multipliers and colors, which can be shown or hidden according to user preference. Manual anchoring is enabled by selecting a bar on the chart and activating the anchor point via a configurable keyboard shortcut, allowing the VWAP calculation to start from that specific point. This flexibility facilitates detailed volume-based price analysis across different timeframes and market sessions.
Профиль индикатора
Отзывы покупателей
4.3
Отзывы: 6
5 | 50 % | |
4 | 33 % | |
3 | 17 % | |
2 | 0 % | |
1 | 0 % |
Отзывы покупателей
August 21, 2025
Nice indicator. My major issue with it is that it automatically fills the bands with the colour selected for the lines. There is no facility to deselect this. Please add the capability to deselect band fill as it can be obtrusive, especially if using colours for another indicator on the chart.
July 9, 2025
Pros: Flexible anchored VWAP with customizable start point. Visual cloud of deviations. Easy integration and stable performance. Cons: No alerts on key levels. No statistics on VWAP re-tests. Lacks tooltip information and quick template saving.
June 18, 2025
June 5, 2025
Really good. all i think is left, is making one on UCT 0. Can you do That? I need to use this indicator to be a reference to a cBot, but i cant do that because the system dont have access to the code. Can you sell one to be used by cBot ¡please!.
Обсуждение
Частые вопросы
VWAP
Продукты, доступные в cTrader Store, включая торговых ботов, индикаторы и плагины, предоставляются сторонними разработчиками и доступны исключительно в информационных и технических целях. cTrader Store не является брокером и не предоставляет инвестиционные консультации, персональные рекомендации или какие-либо гарантии будущей доходности.


Цена
С 27/11/2024
14.22M
Торгуемый объем
8.76K
Выигранные пипы
2.57K
Бесплатные установки