
Descrição
SR COMMANDER — Edição Multi Timeframe
Veja onde o dinheiro grande traça a linha. Negocie no seu timeframe. Pense no deles.
A maioria das ferramentas de suporte e resistência está vinculada ao timeframe do seu gráfico. Se você está fazendo scalping no M1, seus níveis de S/R vêm dos candles M1 — pequenos, barulhentos e facilmente falsificados. O SR Commander MTF quebra essa cadeia.
Configure seu gráfico para M1. Configure seu timeframe SR para H1. Agora você está fazendo scalping com a precisão de um gráfico de um minuto, mas seus níveis de suporte e resistência são desenhados a partir dos candles horários onde instituições, algoritmos e traders profissionais realmente tomam suas decisões. Essa é a vantagem.
COMO FUNCIONA O MOTOR MULTI TIMEFRAME
O indicador executa dois fluxos de dados independentes simultaneamente.
Seu timeframe do gráfico controla o que você vê — seus candles, suas entradas, suas setas, seu timing. Seu timeframe SR controla de onde vêm os níveis. Esses dois fluxos são mapeados um ao outro em tempo real, candle a candle. Quando um novo candle do gráfico fecha, o SR Commander consulta o candle correto do timeframe SR para aquele momento exato e recalcula os níveis a partir da estrutura desse timeframe superior.
Isso significa que sua linha verde de suporte e linha vermelha de resistência sempre refletem a estrutura ponderada pela volatilidade do timeframe SR que você selecionou — não o ruído do gráfico que você está assistindo.
A CIÊNCIA POR TRÁS DOS NÍVEIS
O SR Commander não apenas desenha linhas nos topos e fundos oscilantes. Ele usa um modelo de volatilidade Yang-Zhang — a mesma classe de estimador de volatilidade usada em pesquisas quantitativas profissionais — para calcular o verdadeiro peso estatístico de cada candle. Cada nível é derivado da estrutura de preço normalizada, considerando gaps noturnos, movimento de abertura a fechamento e alcance intrabar. O resultado são níveis que carregam significado matemático real, não apenas destaque visual.
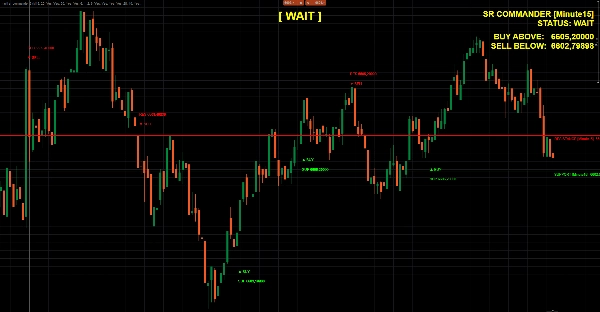
O QUE VOCÊ VÊ NO GRÁFICO
- 🟢 Linha verde de suporte — o piso estatisticamente significativo mais próximo abaixo do preço atual, proveniente do timeframe SR escolhido
- 🔴 Linha vermelha de resistência — o teto estatisticamente significativo mais próximo acima do preço atual, proveniente do timeframe SR escolhido
- ⬆️ Sinal de COMPRA — dispara quando o preço rebate no suporte com um fechamento de candle SR confirmado em alta
- ⬇️ Sinal de VENDA — dispara quando o preço rejeita a resistência com um fechamento de candle SR confirmado em baixa
- 📊 Painel ao vivo — mostra o timeframe SR ativo, status atual e preços exatos de gatilho de rompimento
- 🔵 Grande etiqueta de status — COMPRA / VENDA / ESPERA, atualizada a cada candle no topo central do seu gráfico
- 🕓 Sobreposição histórica — rebotes, rejeições, rompimentos e quedas marcados no gráfico para validação visual instantânea
COMBINAÇÕES DE TIMEFRAME QUE FUNCIONAM
Timeframe do GráficoTimeframe SRCaso de Uso
M1
M5 ou M15
Scalping rápido com estrutura de curto prazo
M5
H1
Negociação intradiária com níveis horários
M15
H4
Entradas swing com estrutura de 4 horas
H1
D1
Negociação de posição com base em S/R diário
Qualquer
Gráfico
Modo clássico — comportamento original de TF único
RECURSOS
- Motor multi timeframe completo — qualquer timeframe SR em qualquer timeframe de gráfico
- Cálculo de nível normalizado pela volatilidade Yang-Zhang
- Inclusão do maior candle — sempre captura o candle de estrutura dominante do período de análise
- Lógica de sinal de rebote e rejeição com tolerância e buffer configuráveis
- Detecção de rompimento e queda com buffer ajustável
- Sobreposição de sinais históricos para validação imediata baseada no gráfico
- Painel e grande etiqueta de status com tamanhos e cores de fonte totalmente personalizáveis
- Zero repaint — todos os sinais baseados em candles fechados quando o modo de confirmação está ativo
PARA QUEM É ISSO?
Traders que entendem que as melhores entradas vivem em timeframes mais baixos, mas os melhores níveis vivem em timeframes mais altos. Se você já desenhou níveis H4 manualmente enquanto negociava no M5 — o SR Commander automatiza todo esse processo, mantém a base matemática e coloca o sinal diretamente no seu gráfico no momento em que o preço reage.
Estrutura de timeframe superior. Precisão de timeframe inferior. Um indicador.
Resumo
The indicator calculates S/R levels using the Yang-Zhang volatility model, which accounts for overnight gaps, open-to-close movement, and intrabar range to produce statistically significant levels rather than simple swing highs and lows. On the chart, it shows a green support line and a red resistance line representing the nearest significant levels below and above the current price from the chosen S/R timeframe.
Additional features include buy and sell signals triggered by price reactions to these levels confirmed on the S/R timeframe, a live dashboard displaying current status and breakout prices, a large status label indicating BUY, SELL, or WAIT, and historical overlays marking past bounces, rejections, and breakouts. The indicator supports various timeframe combinations suitable for scalping, intraday, swing, and position trading across markets including forex, indices, commodities, stocks, and crypto.
Avaliações de clientes
5 | 50 % | |
4 | 50 % | |
3 | 0 % | |
2 | 0 % | |
1 | 0 % |


![Logótipo de "Wyckoff Toolkit [Iridio Capital]"](https://cdn.ctrader.com/image/webp/8acfe6a1-6a8e-4578-9367-9df3af2b1801_27763)


![Logótipo de "Smart Money Concepts (SMC) [Iridio Capital]"](https://cdn.ctrader.com/image/webp/28b69fd1-ef54-4bed-9487-07e78e883be4_40934)


