
Descrição
✅ Linha de tendência suave com mudança de cor que se adapta instantaneamente à direção
✅ Setas opcionais para cima e para baixo para sinais claros de mudança de tendência
✅ Filtra o ruído para destacar transições de tendência limpas e confiáveis
✅ Ideal para seguir tendências, pullbacks e reversões
✅ Totalmente personalizável: período, sensibilidade e exibição de setas
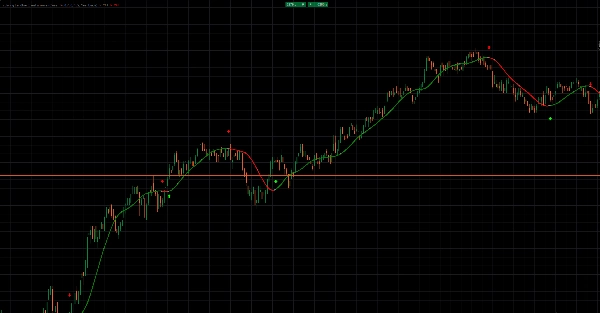
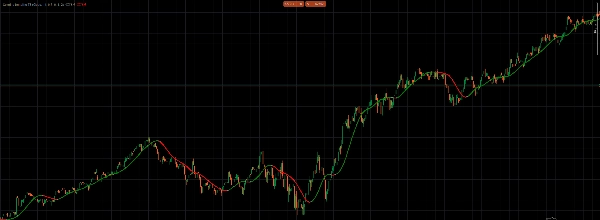
A Linha de Tendência Colorida com Setas oferece uma visão suave e responsiva da direção do mercado sem confusão.
A linha de tendência muda dinamicamente para verde em fases de alta e para vermelho em fases de baixa, tornando a direção da tendência instantaneamente legível.
Quando o momentum inverte, setas opcionais marcam a mudança — setas verdes para tendências de alta, setas vermelhas para tendências de baixa.
Isso permite que você capture pivôs de tendência cedo enquanto evita sinais falsos causados pelo ruído do mercado.
Projetado para clareza, adapta-se suavemente ao preço enquanto mantém uma estrutura direcional forte.
Perfeito para cronometrar entradas, gerenciar saídas e manter-se alinhado com a tendência dominante.
Use-o como uma ferramenta de tendência independente ou combine-o com sua estratégia existente para confirmação adicional.
Visuais limpos. Sinais claros. Negociação de tendência confiante.
Resumo
Avaliações de clientes
5 | 0 % | |
4 | 100 % | |
3 | 0 % | |
2 | 0 % | |
1 | 0 % |


![Logótipo de "Gaussian Channel [Iridio Capital]"](https://cdn.ctrader.com/image/webp/7c039209-5573-4a54-a072-f9528b503103_41960)


