

Описание
WeTrade Trendline Breakout — это умный индикатор ценового действия, который обнаруживает высоковероятные возможности пробоя с помощью динамического анализа трендовых линий. Он автоматически определяет структуру рынка, строит действительные трендовые линии и генерирует точные сигналы на покупку/продажу при пробое ключевых уровней. Встроенные проекции целей и буферы на основе волатильности помогают трейдерам управлять рисками и максимально увеличивать прибыль с уверенностью.
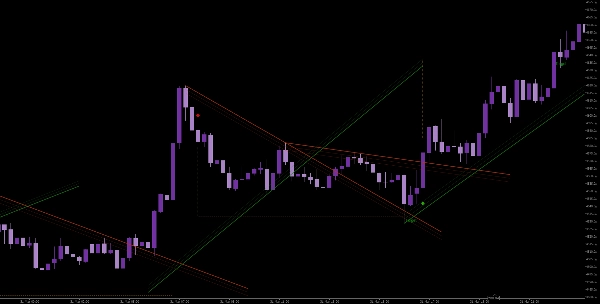
Пробои трендовых линий с целями
Умный индикатор ценового действия, который автоматически обнаруживает пробои трендовых линий и предоставляет четкие сигналы входа с динамическими уровнями целей.
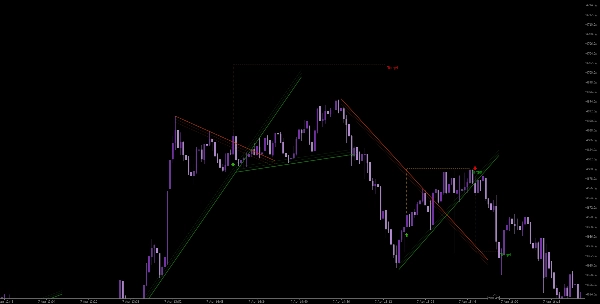
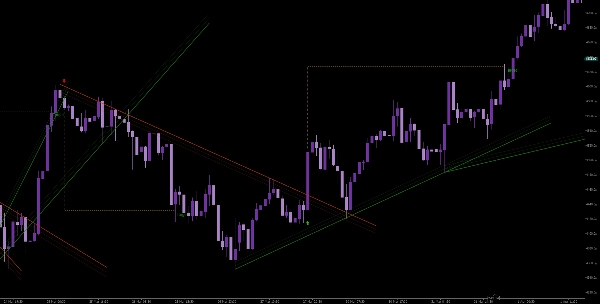
Этот инструмент определяет поворотные максимумы и минимумы для построения действительных трендовых линий на основе реальной структуры рынка. Когда цена пробивает нисходящую линию сопротивления или восходящую линию поддержки, он генерирует точные сигналы на покупку или продажу, используя логику подтверждения закрытием, чтобы уменьшить количество ложных пробоев.
Индикатор включает адаптивную фильтрацию волатильности с использованием ATR, создавая буферные зоны (Z-Bands) вокруг трендовых линий для повышения точности пробоев. При действительном пробое он автоматически строит цели по тейк-профиту и уровни стоп-лосса, помогая трейдерам эффективно управлять риском и прибылью.
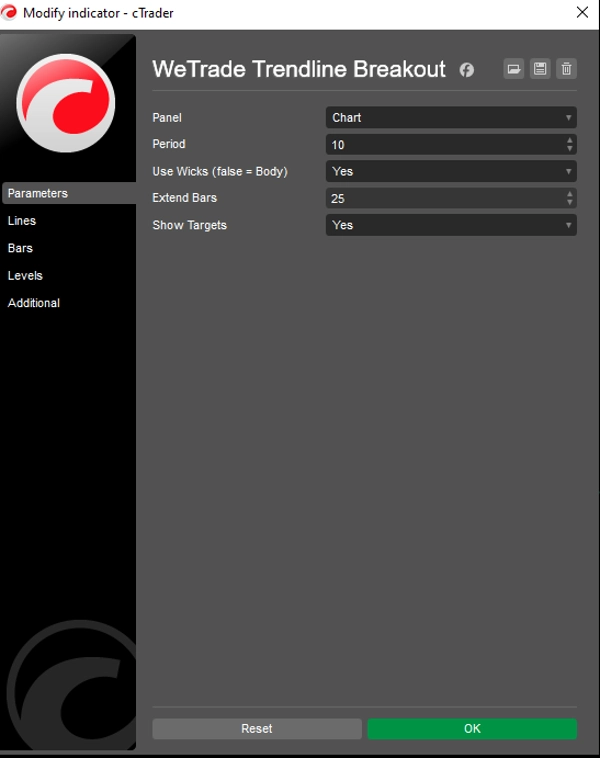
Ключевые особенности:
- Автоматическое обнаружение трендовых линий с использованием структуры поворотов
- Сигналы пробоя с логикой подтверждения
- Динамические буферные зоны на основе ATR (Z-Bands)
- Встроенная визуализация тейк-профита и стоп-лосса
- Чистое отображение на графике с опциональными уровнями целей
- Работает на всех инструментах и таймфреймах
Разработан для трейдеров, которые сосредоточены на структуре, импульсе и дисциплинированном исполнении.
Сводка
Key features include ATR-based dynamic buffer zones (Z-Bands) that adapt to market volatility, enhancing breakout accuracy. Upon a confirmed breakout, the tool automatically plots take-profit targets and stop-loss levels, aiding in risk and reward management. The indicator offers a clean chart display with optional target visualization and supports all instruments and timeframes.
This tool is suitable for traders focusing on market structure, momentum, and disciplined trade execution across various markets including Forex, cryptocurrencies, commodities, indices, and stocks. It provides breakout signals and trend strength insights based on price action and volatility measures.
Отзывы покупателей
5 | 100 % | |
4 | 0 % | |
3 | 0 % | |
2 | 0 % | |
1 | 0 % |


