
ICT First Presented FVG
Индикатор
188 скачивания
Версия 1.1, Apr 2026
Windows, Mac

Описание
Это специализированный индикатор на основе ИКТ, который фокусируется на одной "якорной" точке: открытии Нью-Йоркской фондовой биржи в 9:30 утра.
Вот краткое и по существу объяснение:
🎯 Основная функция
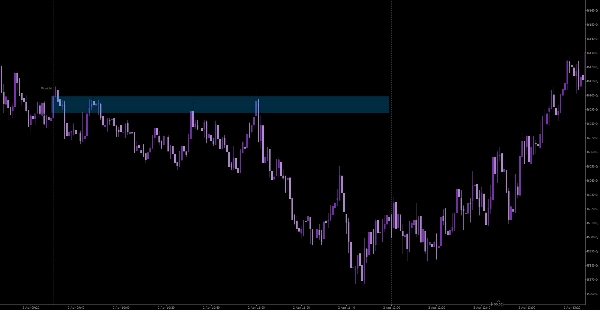
Индикатор игнорирует все ценовые движения до открытия в 9:30 утра. Как только рынок открывается, он ищет самый первый Fair Value Gap (FVG), который появляется. В теории ИКТ этот первый гэп часто является "институциональным следом" направления утренней сессии.
🛠️ Ключевые особенности
- Автоматический поиск: Вам не нужно самостоятельно просматривать 1-минутный или 5-минутный график; он сразу выделяет первый действительный дисбаланс после звонка.
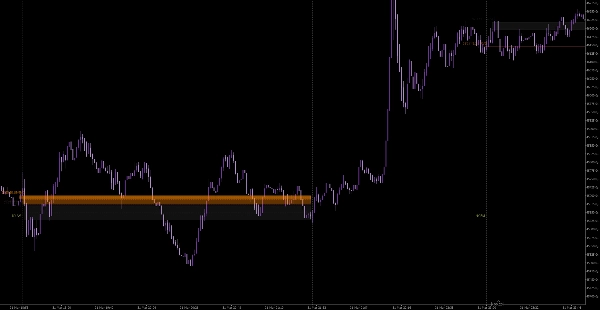
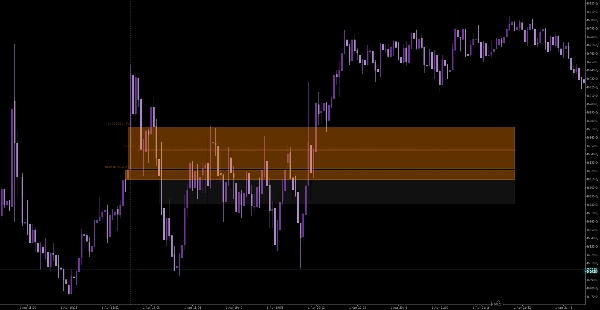
- Расширенные боксы: Он рисует коробку, которая проецируется вперёд до текущей цены. Это позволяет видеть, "ретестит" ли или "заполняет" цена этот конкретный утренний гэп позже в течение дня.
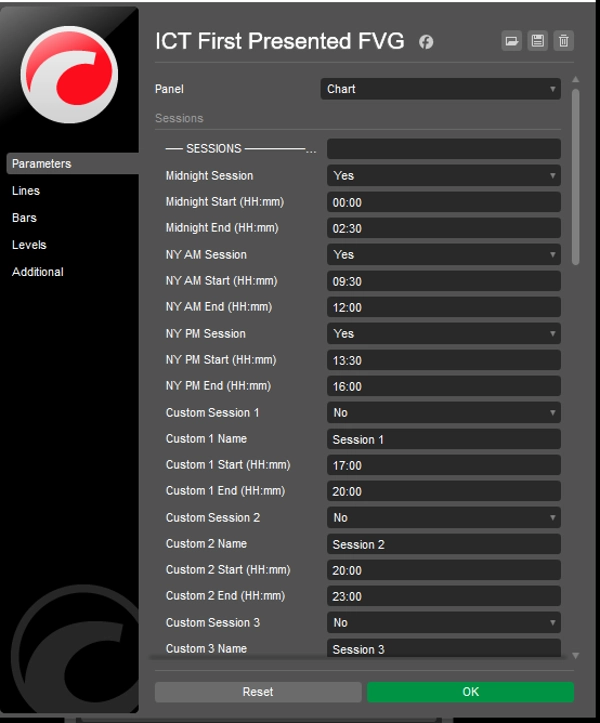
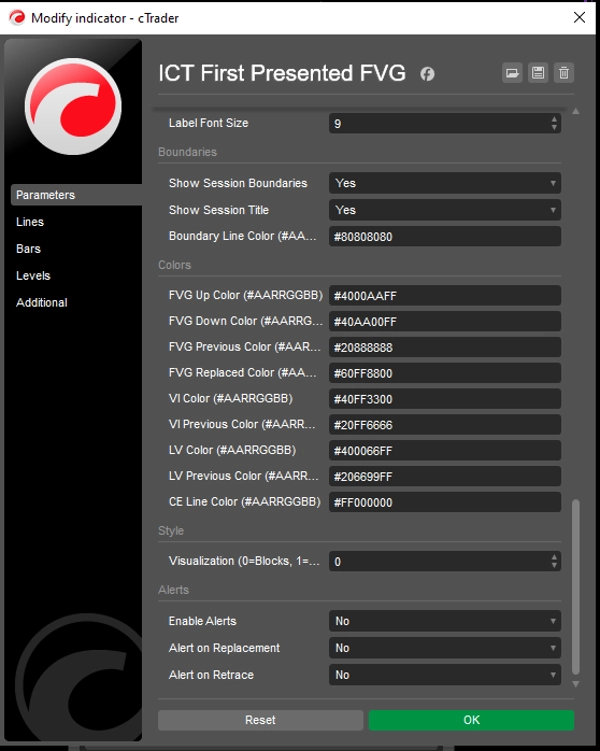
- Визуальный контроль: Вы можете переключаться между сплошными блоками или простыми линиями и менять цвета, чтобы подстроить под ваш шаблон графика.
- Отслеживание паттернов: Добавляет метки с датами, чтобы вы могли посмотреть назад на предыдущие дни и увидеть, как часто FVG в 9:30 утра удерживался в качестве поддержки или сопротивления.
💡 Как улучшить результаты
Хотя этот инструмент отлично подходит для поиска "сигнала", он не даёт "контекста". Чтобы повысить процент успешных сделок с его помощью:
- Смещение по старшему таймфрейму: Берите "лонг" по FVG в 9:30 только если ваш тренд на 1-часовом или 4-часовом графике уже бычий. Если брать каждый "первый FVG" вслепую, вас будут "резать".
- Ждите "качели Иуды": Часто первый FVG в 9:30 — это ловушка (фальшивое движение). Если первый FVG не сработал и цена формирует второй в противоположном направлении, это обычно настоящее движение дня.
- Правило "заполнения": Если цена возвращается и полностью закрывает FVG в 9:30, её институциональная "сила" исчезает. Ищите сделки только там, где цена касается края бокса и отскакивает от него.
Сводка
ИИ-сводка
ICT First Presented FVG is a specialized trading indicator based on Inner Circle Trader (ICT) theory, designed to identify the first Fair Value Gap (FVG) that forms immediately after the 9:30 AM New York Stock Exchange open. This initial gap is considered a key institutional footprint indicating the morning session’s directional bias.
Key features include automated detection of the first valid imbalance after the market opens, eliminating the need for manual scanning of short-term charts. The indicator visually highlights this gap with an extended box projecting forward to the current price, allowing traders to monitor if and when the gap is retested or filled during the day. Users can customize the visual style with solid blocks or lines and adjust colors to match their chart templates. Additionally, date labels track past occurrences to analyze how often the 9:30 AM FVG acts as support or resistance.
The indicator supports markets including Forex, indices, commodities, stocks, and cryptocurrencies such as BTCUSD and EURUSD. It is intended to be used alongside higher timeframe trend analysis and price action context to improve trade decision-making, particularly by observing patterns like the "Judas Swing" and the behavior of price around the FVG fill level.
Профиль индикатора
Отзывы покупателей
0.0
Отзывы: 0
Отзывы покупателей
У этого продукта еще нет отзывов. Уже попробовали его? Поделитесь впечатлениями!
Обсуждение
Частые вопросы
BTCUSD
Forex
Signal
Breakout
Indices
EURUSD
Commodities
GBPUSD
NZDUSD
Martingale
Prop
Scalping
SMC
Crypto
Grid
Stocks
AI
XAUUSD
NAS100
USDJPY
Продукты, доступные в cTrader Store, включая торговых ботов, индикаторы и плагины, предоставляются сторонними разработчиками и доступны исключительно в информационных и технических целях. cTrader Store не является брокером и не предоставляет инвестиционные консультации, персональные рекомендации или какие-либо гарантии будущей доходности.
Больше от этого автора


Цена
2.85K
Бесплатные установки