Beschreibung
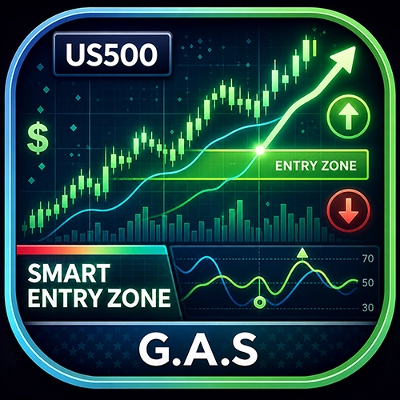
G.A.S - Smart Entry Zone ist ein Price-Action-Indikator für US500 (S&P 500 CFD), der
Händlern hilft, Einstiegsstellen mit hoher Wahrscheinlichkeit rund um eine manuell definierte Preiszone zu identifizieren.
--- WAS ER ANALYSIERT ---
Der Indikator überwacht das Preisverhalten rund um zwei vom Benutzer definierte horizontale Niveaus - die
oberen und unteren Grenzen der Smart Entry Zone. Er verfolgt, wie der Preis sich diesen Niveaus nähert,
sie durchbricht und darauf reagiert, und zwar Balken für Balken, wobei er nach spezifischen
Bestätigungsmustern sucht, bevor ein Signal generiert wird.
--- WIE MAN SIGNALE UND VISUELLE ELEMENTE INTERPRETIERT ---
Zonenlinien markieren die oberen und unteren Grenzen der Einstiegszone für den ausgewählten
Handelstag. Drei Signaltypen werden erkannt:
- Fall A - Der Preis sticht durch die Zone und schließt dann wieder außerhalb. Eine Folgebalken-Schlusskurs in Richtung des Ausbruchs löst das Signal aus. Ein Signal
pro Durchbruch-Ereignis (Einzelschuss).
- Fall B - Der vorherige Balken schloss außerhalb der Zone, der aktuelle Balken sticht durch sie und
schließt wieder außerhalb. Bestätigt einen Retest der Zonenbegrenzung.
- Fall C - Zum genauen Öffnen des Signalzeitfensters befindet sich der Preis bereits
außerhalb der Zone. Der erste bestätigende Balken in diese Richtung löst das Signal aus.
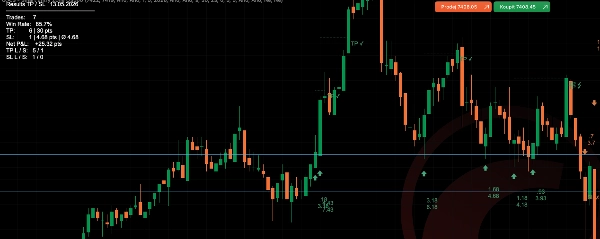
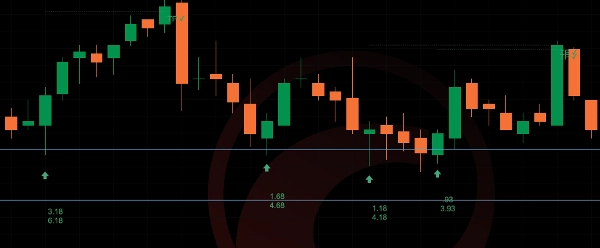
Signale werden als Pfeile unterhalb (bullisch) oder oberhalb (bärisch) des Signalbalkens angezeigt.
Wenn die TP/SL-Anzeige aktiviert ist, zeigen gepunktete Linien die Take-Profit- und Stop-Loss-Niveaus
vom Einstiegsbalken an. Ein TP- oder SL-Label markiert das Ergebnis, wenn das Niveau erreicht wird.
Das optionale SL-Distanz-Label zeigt in Echtzeit, wie weit der aktuelle Preis von
der Stop-Loss-Zonenbegrenzung entfernt ist.
--- WICHTIGE EINSTELLUNGEN UND PARAMETER ---
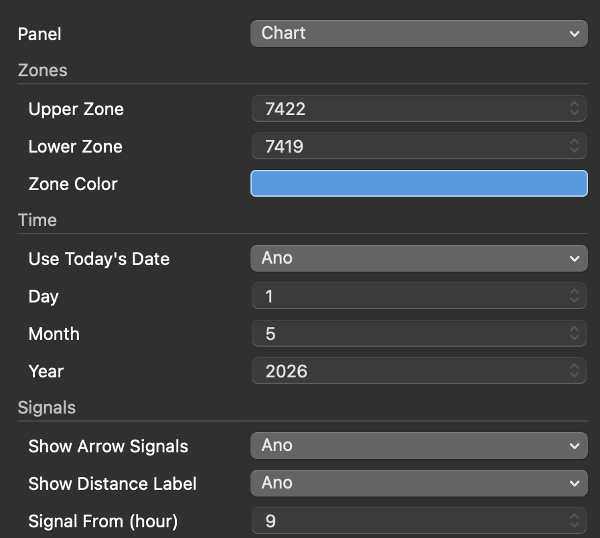
- Zonen: oberes und unteres Preisniveau, Linienfarbe, anzeigen/verbergen
- Datum: heutiges Datum automatisch verwenden oder ein bestimmtes Datum manuell einstellen
- Signale: Pfeile aktivieren, Zeitfenster konfigurieren (z.B. 15:30 / 23:00), Durchbruch-Rückblick
(wie viele Balken nach einem Durchbruch das Signal gültig bleibt), Distanz-Labels an/aus
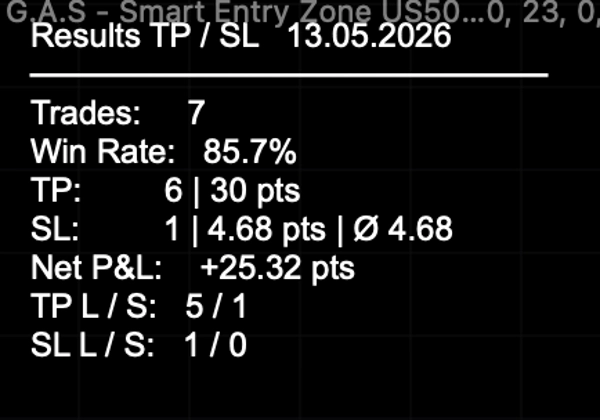
- TP/SL: Take Profit in Punkten, Linien und Labels anzeigen, Ergebnistabelle an/aus,
Einzelhandelmodus (jeweils nur ein offener Trade), benutzerdefinierte Farben
- SL-Distanz: Label aktivieren, benutzerdefinierte Farbe
--- TYPISCHE ANWENDUNGSFÄLLE UND HANDELSSZENARIEN ---
Der Indikator ist für den Intraday-Handel des US500 auf einem 5-Minuten-Chart konzipiert. Ein typischer
Arbeitsablauf ist: Vor der Öffnung des US-Marktes legt der Händler die oberen und unteren Zonenlevel
für den Tag fest. Sobald das Signalfenster öffnet (Standard 15:30 Prag / 09:30 New York), überwacht der
Indikator die Setups Fall A, B oder C und markiert gültige Einstiege mit Pfeilen.
Der TP/SL-Tracker protokolliert automatisch die Ergebnisse über die Sitzung hinweg.
--- FÜR WEN DIESER INDIKATOR AM BESTEN GEEIGNET IST ---
Fortgeschrittene bis erfahrene Händler, die bereits eine definierte Intraday-Methodik haben und
feste Preiszonen als Teil ihres Entscheidungsprozesses verwenden. Der Indikator generiert
Zonen nicht automatisch – der Händler muss die Level jeden Tag manuell identifizieren und eingeben.
Er ist nicht geeignet für Anfänger, die ein vollautomatisches Signalsystem suchen.
--- WICHTIGE EINSCHRÄNKUNGEN UND HINWEISE ZUR NUTZUNG ---
- Zonenlevel müssen jeden Handelstag manuell eingegeben werden – der Indikator berechnet sie nicht automatisch.
- Entwickelt und getestet für US500 auf einem 5-Minuten-Chart. Verhalten bei anderen Instrumenten
oder Zeitrahmen ist nicht garantiert.
- Vergangene Signalstatistiken in der Ergebnistabelle dienen nur als Referenz und stellen keine
Garantie für zukünftige Leistungen dar.
- Das Signalzeitfenster verwendet intern die Prager Zeit (CET/CEST). Passen Sie die
von/bis-Stundeneinstellungen an, wenn Ihr Broker eine andere Serverzeit verwendet.
Zusammenfassung
Signals appear as arrows indicating bullish or bearish entries, with optional automatic tracking and display of take profit (TP) and stop loss (SL) levels, including real-time SL distance labels. Users can customize zone levels, signal time windows, TP/SL parameters, and visual elements. The indicator logs trade statistics throughout the session for performance reference.
Intended for intermediate to advanced traders who incorporate fixed price zones into their intraday strategies, it requires manual input of zone levels daily and is specifically tailored for the US500 instrument. The indicator does not generate zones automatically and is not designed for other instruments or timeframes. Time settings use Prague time internally and should be adjusted if needed.