
설명
🌐 기관 흐름 읽기로 시장을 지배하세요
무엇을 보여주는가: 실제 체결된 거래 — 진정한 공격 흐름.
장점: 이 지표는 틱 데이터로 표현됩니다.
이미 시장에 투입된 자금을 나타냅니다.
공격자 분류 (매수자/매도자가 호가를 타격함).
흡수, 소진, 흐름 가속을 감지합니다.
📈 무료 지표인 가격별 거래량, 볼륨 스퀴저와 결합하세요.
https://ctrader.com/products/2514 https://ctrader.com/products/2874
오더 플로우
테이프 리딩
사다리 DOM
기관 흡수
지능형 돌파
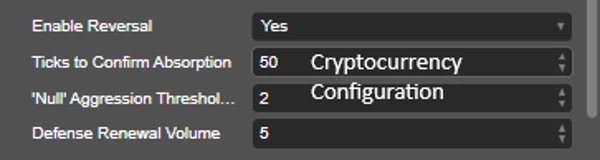
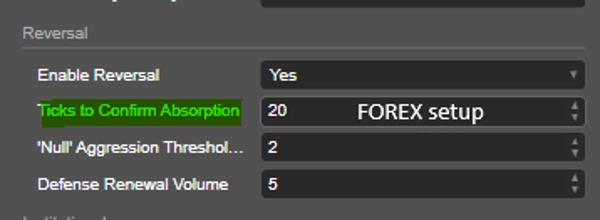
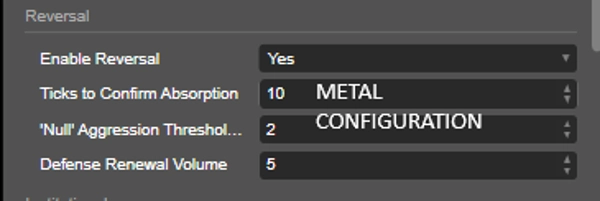
흐름 반전
매수 및 매도 압력
실시간 공격 분석
시스템은 전통적인 차트를 진정한 기관 시장 읽기 허브로 변환합니다.
알고리즘의 차별점
일반 지표가 캔들스틱만 분석하는 반면, 테이프 리딩 스캘퍼는 다음을 해석합니다:
✅ 매수자와 매도자의 실제 공격성
✅ 흐름 속도
✅ 기관 방어
✅ 주문 흡수
✅ 사다리 가속
✅ 흐름으로 확인된 돌파
✅ 소진에 의한 반전
✅ 기관 대 소매 압력
✅ 지능형 로트 스케일링
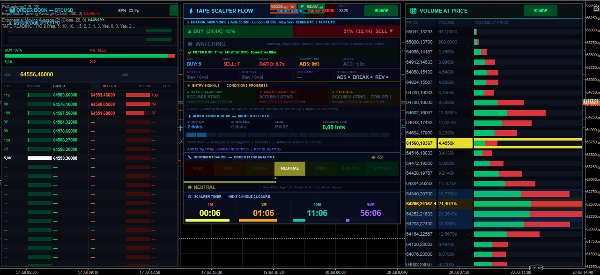
시스템 구조
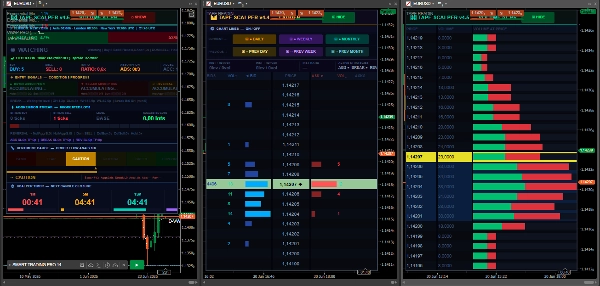
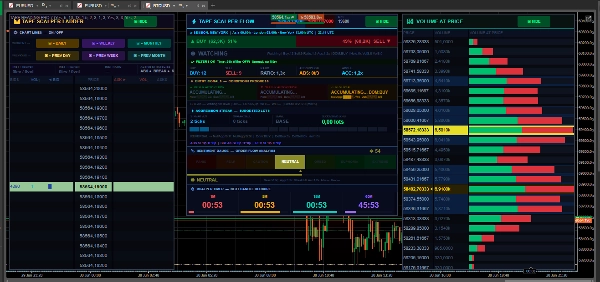
알고리즘은 2개의 독립적인 전문 패널을 가지고 있습니다:
⚡ 플로우 패널 (윈도우 1)
운영 읽기 및 신호 생성을 담당하는 패널.
표시 내용:
매수자/매도자 흐름
흡수
반전
돌파
공격 연속
시장 세션
매수/매도 비율
사다리 가속
동적 SL/TP
운영 필터
📊 사다리 패널 (윈도우 2)
기관 패널로 집중하는 부분:
DOM 사다리
기관 레벨
가격별 거래량
기관 압력
POC
범위
일간 및 주간 고가/저가
가격 책
기관 열기
사다리 기능 설명
1. 매수 공격성
현재 매수자의 공격성을 보여줍니다.
급격히 증가할 때:
매수자가 강하게 진입합니다. 시장이 상승 가속할 수 있습니다. 돌파 가능성을 나타냅니다.
숫자가 높을수록:
➡ 더 큰 매수 압력.
2. 매도 공격성
매도자의 공격성을 보여줍니다.
급격히 증가할 때:
매도자가 우세합니다
하락 지속 가능성
기관의 숏 진입
3. 매수/매도 비율
매수자와 매도자 간의 관계를 보여줍니다.
예:
비율 2.0x = 매수자 우세
비율 3.0x = 강한 기관 압력
비율이 1.0 미만 = 매도자 우세
해석:
비율 해석
1.0 균형
1.5 중간 압력
2.0 이상 강한 추세
3.0 이상 강한 기관 흐름
4. 흡수
알고리즘의 가장 강력한 기능 중 하나입니다.
시스템은 다음을 감지합니다:
큰 공격적 거래량이 있지만
가격이 움직이지 않을 때
이는 다음을 의미합니다:
➡ 기관 투자자가 주문을 흡수하고 있습니다.
매수자 흡수
시장은 많은 매도를 받지만:
가격 하락이 멈춥니다. 기관 방어가 나타납니다. 매수로의 반전 가능성.
신호:
▲ 매수자 흡수
매도자 흡수
시장은 많은 매수를 받지만:
가격이 오르지 않습니다. 매도자가 움직임을 억제합니다. 매도로의 반전 가능성.
신호:
▼ 매도자 흡수
5. 사다리 가속
DOM 내 흐름 속도를 측정합니다.
알고리즘은 다음을 비교합니다:
최근 흐름
대 이전 흐름
가속할 때:
➡ 기관 진입 가능성.
예:
값 의미
1.0x 정상 흐름
1.5x 강한 가속
2.0x+ 기관 폭발
6. 돌파 감지
진정한 돌파를 감지합니다.
시스템은 다음을 검증합니다:
✅ 거래량
✅ 공격성
✅ 속도
✅ 연속
✅ 기관 흐름
✅ 사다리 가속
돌파 매수
조건:
강한 매수 공격성 사다리 가속 기관 압력 고점 돌파
결과:
➡ 검증된 매수 진입.
돌파 매도
조건:
강한 매도 압력 매도 기관 흐름 지지선 돌파
결과:
➡ 매도 확인.
7. 반전 감지
소진으로 인한 반전을 감지합니다.
시스템은 다음을 식별합니다:
공격성 사라짐 기관 방어 등장 추세 강도 상실
결과:
➡ 예상된 반전.
8. 연속 시스템
지능형 흐름 연속성 시스템.
연속으로 발생한 틱 수를 계산합니다:
연속 매수
또는
연속 매도
연속 레벨
레벨 의미
레벨 1 초기 추세
레벨 2 강한 흐름
레벨 3 폭발적 움직임
9. 제안된 로트
알고리즘은 자동으로 제안합니다:
증가된 로트 크기
감소된 위험
운영 규모
기반:
✅ 흐름 강도
✅ 연속성
✅ 기관 강도
11. POC (통제점)
가장 높은 거래량을 가진 가격을 보여줍니다.
중요성:
강한 지지/저항
기관 구역
방어 지역
12. 일간/주간 레벨
자동 선:
일간 최고가
일간 최저가
주간 최고가
주간 최저가
사용 용도:
✅ 돌파
✅ 반전
✅ 유동성
✅ 손절 주문
13. 기관 필터
고급 기관 필터.
차이점:
소매 흐름
대 기관 흐름
시스템은 다음을 검증합니다:
✅ 기관 클러스터
✅ 레벨별 거래량
✅ 우세 압력
📈 이 지표를 전략 진입 확인용으로 사용하세요. 흐름, 흡수 신호, 테이프 속도, 틱 내 공격성 및 심리 분석의 중요성을 강조할 가치가 있습니다.
요약
Key functionalities include detection of institutional absorption (when large volume does not move price), breakout validation through volume and flow speed, reversal anticipation by exhaustion signals, and an intelligent streak system counting consecutive buy or sell ticks. The indicator also suggests lot sizing based on flow strength and institutional intensity, and applies an institutional filter distinguishing retail versus institutional flow.
Tape Reading 4.2 supports analysis of key market levels, real-time aggression, and flow reversals, transforming traditional charts into comprehensive institutional market reading tools. It is suitable for traders seeking detailed order flow insights and confirmation signals for entries based on market microstructure and volume dynamics.
고객 리뷰
5 | 50 % | |
4 | 50 % | |
3 | 0 % | |
2 | 0 % | |
1 | 0 % |


!["Smart Money Concepts (SMC) [Iridio Capital]" 로고](https://cdn.ctrader.com/image/webp/28b69fd1-ef54-4bed-9487-07e78e883be4_40934)


