الوصف
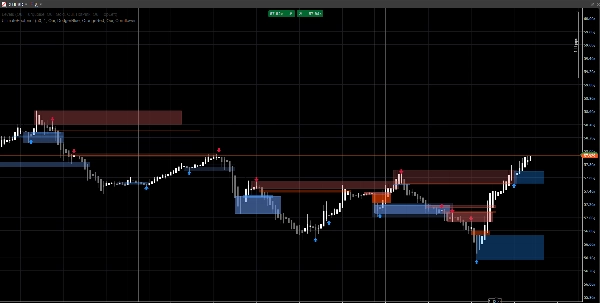
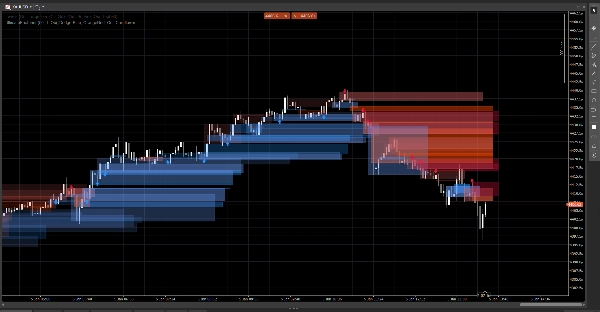
نظام هيكل سوق نظيف يعرض فجوات الأسعار، كتل الأوامر، و إشارات الانفجار، مع تأكيد الحجم اختياري و تنبيهات إعادة الاختبار. مصمم للوضوح على كل من الرسوم البيانية القياسية ورينكو.
يركز هذا المؤشر على القراءة والتنفيذ، وليس الفوضى. يتم تمديد المناطق إلى الأمام وإدارتها تلقائيًا (انتهاء الصلاحية / الإبطال)، مما يساعدك على تتبع المستويات المهمة أثناء تطور السعر.
ما الذي يكتشفه
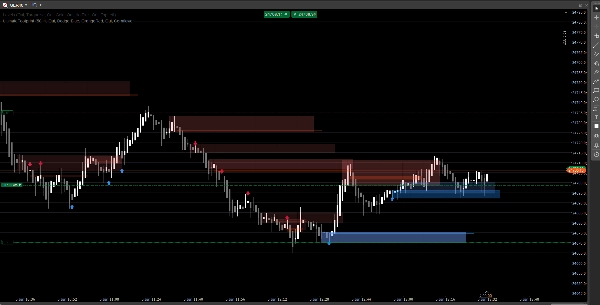
فجوات الأسعار (عدم كفاءة 3 أشرطة)
- يسلط الضوء على الفجوات الصاعدة والهابطة مباشرة على الرسم البياني
- عرض اختياري (تشغيل/إيقاف)
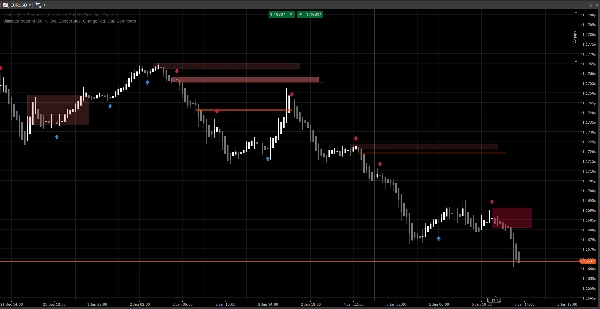
كتل الأوامر (آخر شمعة معاكسة قبل الإزاحة)
- مناطق كتل أوامر صاعدة وهابطة
- تمتد تلقائيًا إلى الأمام حتى يتم إبطالها / الوصول إلى الحد الأقصى للتمديد
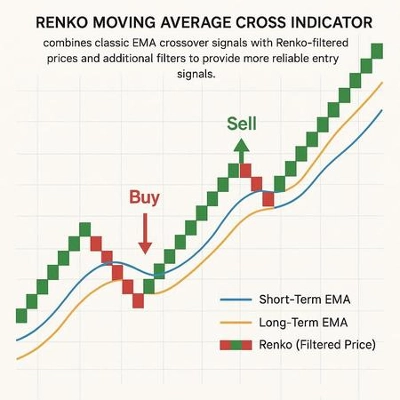
إشارات كسر الهيكل (منطق كسر التأرجح)
- الكشف بناءً على الانفجار باستخدام قمم/قيعان التأرجح
- يطبع أسهم الإشارة (أعلى/أسفل) عند تأكيد كتلة أمر جديدة
تحديثات في الوقت الحقيقي
- مصمم ليبقى محدثًا بسلاسة في الظروف الحية
- يعمل على الشموع الكلاسيكية ويتصرف جيدًا على حركة السعر بأسلوب رينكو
تصفية ذكية (اختياري)
تأكيد الحجم
- يمكنك طلب تأكيد درجة Z للحجم قبل التحقق من إشارة كتلة الأمر
- خط أساس وحساسية قابلة للتعديل
تنبيهات (اختياري)
تمكين التنبيهات لـ:
- اكتشاف كتلة أمر جديدة
- إعادة اختبار كتلة الأمر مع الاتجاه (شمعة الرفض)
كيفية استخدامه (سير عمل بسيط)
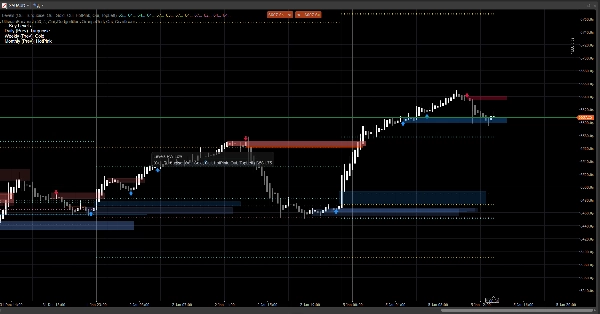
- استخدم فجوات الأسعار و كتل الأوامر كـ مناطق رد فعل (مناطق اهتمام).
- دع الإشارات تبرز كسر الهيكل وتشكيل كتلة الأمر المقابلة.
- استخدم تنبيهات إعادة الاختبار لالتقاط العودة إلى المنطقة مع سلوك الرفض.
- ادمجها مع إدخالاتك/مخارجك الخاصة (إدارة المخاطر تبقى من مسؤوليتك).
نظرة عامة على المدخلات
منطق الحجم
- خط أساس الحجم: فترة التنعيم المستخدمة لحساب درجة Z
- حساسية الحجم: تتحكم في مدى تأثير الحجم على وضوح المنطقة
فجوات الأسعار
- عرض فجوات الأسعار
- ألوان الفجوات الصاعدة / الهابطة
كتل الأوامر
- عرض كتلة الأمر
- ألوان كتل الأوامر الصاعدة / الهابطة
- التمديد الأقصى: مدى تمدد المناطق إلى الأمام
الإشارات
- عرض الأسهم
- نظرة التأرجح للخلف: يحدد نافذة الكشف عن التأرجح
- طلب تأكيد الحجم (اختياري)
- عتبة الحجم + فترة الحجم
- ألوان الإشارة
- شفافية المنطقة
- أقصى عدد أشرطة للتمديد (الإشارات)
التنبيهات
- تمكين التنبيهات
- تنبيه كتلة أمر جديدة
- تنبيه إعادة الاختبار
الأسئلة الشائعة
1) هل يعيد الرسم؟
لا.
المؤشر لا “ينقل” الإشارات التاريخية إلى مواقع جديدة بعد إغلاق الشمعة.
- المناطق (فجوات / مستطيلات كتلة الأوامر) تُنشأ من الأشرطة التاريخية ثم تمتد إلى الأمام.
- الإشارات (الأسهم) تُؤكد من شروط الشمعة المغلقة (كسر التأرجح + اختيار كتلة الأمر).
بمجرد طباعة السهم، لا يتم إعادة تحديد موقعه بأثر رجعي.
تفصيل مهم (السلوك الطبيعي):
بينما الشمعة الحالية لا تزال تتشكل، يمكن أن تتغير الأسعار (الأعلى/الأدنى/الإغلاق). هذا يمكن أن يسبب:
- تحديث المنطقة لتمديد الحافة اليمنى (تمديد بصري)،
- أن تكون حالة إعادة الاختبار صحيحة مؤقتًا ثم خاطئة على نفس الشمعة المتشكلة.
هذا ليس إعادة رسم—إنه تحديث في الوقت الحقيقي على شمعة غير مكتملة.
2) ما الفرق بين “إعادة الرسم” و “إعادة التلوين” هنا؟
إعادة الرسم = نعم (بحسب التصميم).
إعادة التلوين = لا.
- إعادة الرسم تعني أن المستطيلات تُعاد رسمها/تمديدها على الرسم البياني بحيث تستمر المنطقة في الإسقاط إلى المستقبل. هذا مطلوب لتراكب “بصمة” مباشر.
- إعادة التلوين تعني أن المؤشر يغير الإشارات المؤكدة السابقة (الأسهم/المناطق) بعد الحدث. هذا لا يحدث.
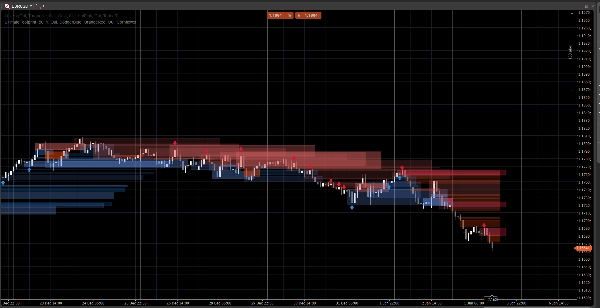
3) لماذا تتغير أحيانًا شكل أو شفافية المناطق؟
لأن المناطق موزونة بالحجم باستخدام نموذج درجة Z:
SMA(volume)+StdDev(volume)على فترة خط الأساس الخاصة بك- الشفافية/الألفا تتناسب مع انحراف الحجم
لذا إذا قمت بتغيير:
- خط أساس الحجم
- حساسية الحجم
- أو يختلف مصدر الرمز
يمكن أن تختلف شدة العرض. تبقى موقع المنطقة معتمدة على السعر؛ ويمكن أن تعكس الرؤية سياق الحجم.
4) لماذا تكون بعض التنبيهات “مفقودة” أو “مطفأة” أحيانًا؟
هناك 3 أسباب فنية، وجميعها مقصودة:
أ) التنبيهات تتطلب شرط تلاقي صارم
لـ تنبيه إعادة الاختبار، يتطلب المؤشر:
- تداخل السعر مع منطقة كتلة الأمر، و
- تحقق شرط شمعة الرفض (مثال: الرفض الصاعد يتطلب
الإغلاق > الافتتاح)
إذا لمس السعر المنطقة لكنه أغلق محايدًا / معاكسا، لا يتم إطلاق تنبيه إعادة الاختبار.
ب) منطق التنبيه لمرة واحدة (مكافحة الرسائل المزعجة)
كل كتلة أمر لها علم داخلي (مثال: تم التنبيه) حتى لا تتلقى تنبيهات متكررة على كل تحديث.
لذا إذا لم يلبس اللمس الأول قاعدة الرفض، ثم لبسها لاحقًا لكن العلم كان مضبوطًا بالفعل (حسب نسختك)، فقد يظهر “مطفأ”.
ج) سلوك نوع الرسم البياني (رينكو / تجميع التيك)
في رينكو، “الطوبة الحالية” ليست شمعة كلاسيكية. أثناء التشكيل:
- الافتتاح/الإغلاق قد يكون غير مستقر أو متساوٍ
- منطق إعادة الاختبار قد يحدث داخل الشمعة لكنه لا يتأكد عند الإغلاق
في التداول الحي، لأقصى موثوقية:
- تنبيهات كتلة الأمر الجديدة عادة ما تكون واضحة
- تنبيهات إعادة الاختبار من الأفضل اعتبارها تنبيهات “رفض مؤكدة” (وليس مجرد لمس الفتيل)
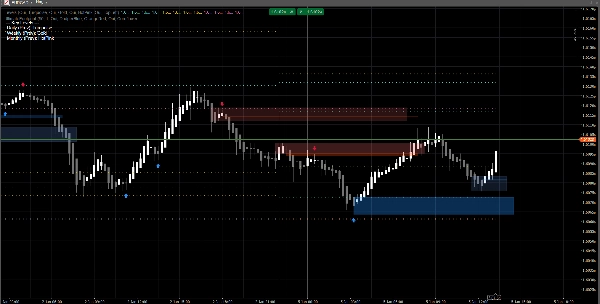
5) في الصورة: لماذا لا تظهر بعض كتل الأوامر سهمًا (أو لماذا لا يتطابق السهم مع كل كتلة أمر)؟
لأن المناطق والأسهم ليست من نفس المحرك:
- المناطق (مستطيلات كتلة الأوامر) يمكن عرضها من منطق اكتشاف المنطقة (كتلة الأمر المشتقة من الفجوة / مناطق حركة السعر).
- الأسهم تُطبع فقط عند اكتشاف حدث هيكلي:
-
- كسر قمة/قاع تأرجح (كسر الهيكل)،
- ثم يبحث الخوارزمية إلى الوراء للعثور على آخر شمعة معاكسة = كتلة الأمر الصالحة.
لذا قد ترى منطقة كتلة أمر بدون سهم إذا:
- لم يكن هناك كسر تأرجح مؤكد،
- لم يستوفِ مرشح الحجم (إذا تم تمكينه)،
- أو هي منطقة أنشأها محرك الفجوة ولكن لم يؤكدها محرك الهيكل.
هذا هو بالضبط سبب فائدة الأداة:
المناطق تعطيك الخريطة. الأسهم تبرز لحظات أعلى تلاقي.
6) هل يمكنني إجبار كتل الأوامر على التطابق دائمًا مع الأسهم؟
نعم، تقنيًا يمكنك تشغيله في وضع “الإشارات فقط” عن طريق تعطيل طبقة المنطقة التي لا تريدها:
- أوقف تشغيل فجوات الأسعار إذا كنت تريد فقط مناطق مدفوعة بالهيكل
- أوقف تشغيل عرض كتلة الأمر (المناطق) إذا كنت تريد فقط كتل أوامر مؤكدة بالأسهم
7) هل يعمل على جميع الأطر الزمنية والرموز؟
نعم، لكن النتائج تعتمد على:
- التقلب،
- السيولة،
- جودة حجم التيك،
- وجلسة السوق.
تتصرف العملات الرقمية والمؤشرات بشكل مختلف عن الفوركس.
ملاحظات وإخلاء مسؤولية
هذا المؤشر هو أداة دعم قرار بصرية، وليس خدمة إشارات ولا نصيحة مالية.
تتصرف جميع الأسواق والأطر الزمنية بشكل مختلف — تحقق دائمًا من بياناتك وأدر المخاطر بشكل مناسب. السلوك الماضي لا يضمن النتائج المستقبلية.
الملخص
تقييمات العملاء
5 | 100 % | |
4 | 0 % | |
3 | 0 % | |
2 | 0 % | |
1 | 0 % |