Descripción
Versión mejorada con control de umbral de llenado parcial, seguimiento preciso de la antigüedad y niveles automáticos de Fibonacci en gaps.
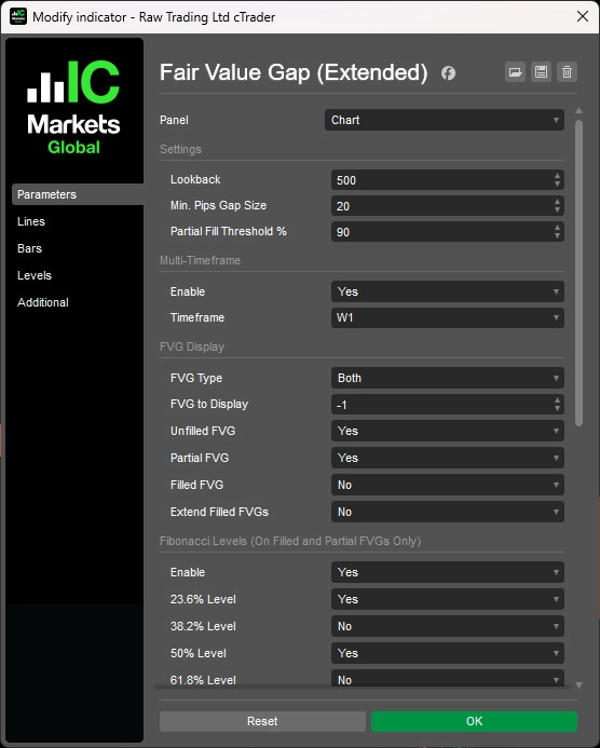
Detecta automáticamente gaps alcistas y bajistas con umbral de llenado parcial configurable (50-99%, por defecto 90%), muestra la antigüedad del gap en formato años/meses/semanas/días y proyecta cinco niveles de Fibonacci (23.6% a 78.6%) en FVGs parciales y llenados.
Escaneo multitemporal para alinear gaps estructurales de HTF con la acción del precio en LTF, opción para extender las cajas de FVG llenadas hasta la barra actual, visualización ilimitada de gaps históricos (-1 configuración), actualizaciones dinámicas de estado (sin llenar/parcialmente llenado/llenado) y etiquetado mínimo no intrusivo ofrecen un análisis completo del desequilibrio de liquidez para traders que buscan llenados de gaps con zonas de entrada basadas en Fibonacci.
CARACTERÍSTICAS
Identificación Mejorada de FVG
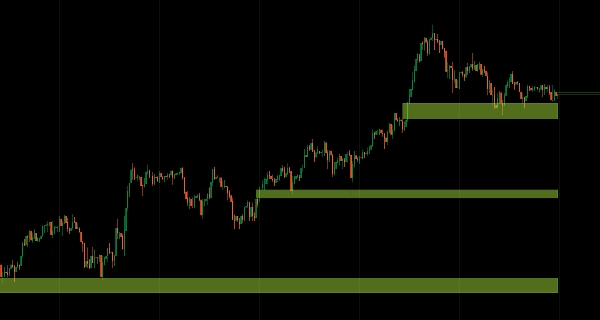
- Encuentra automáticamente gaps de Valor Justo alcistas y bajistas
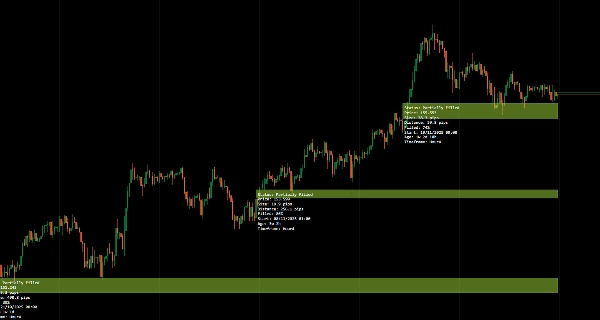
- Rastrea en tiempo real el estado sin llenar, parcialmente llenado y completamente llenado
- Umbral de llenado parcial: controla cuándo el llenado parcial se convierte en llenado completo (50-99%, por defecto 90%)
- Representación visual limpia con mínimo desorden en el gráfico
Visualización Mejorada de la Antigüedad
- Muestra la antigüedad precisa del gap en años, meses, semanas y días (por ejemplo, "3a 2s 4d")
- Ayuda a priorizar gaps frescos frente a obsoletos para la selección de operaciones
- El contexto temporal mejora la toma de decisiones sobre la relevancia del gap
Seguimiento y Visualización del Estado
- Muestra el estado actual de llenado: sin llenar, parcialmente llenado o completamente llenado
- Se actualiza dinámicamente conforme el precio interactúa con el gap
- Confirmación visual de captura de liquidez
- Extender FVGs llenados: opción para extender las cajas de FVG llenadas hasta la barra actual como referencia
Niveles de Fibonacci
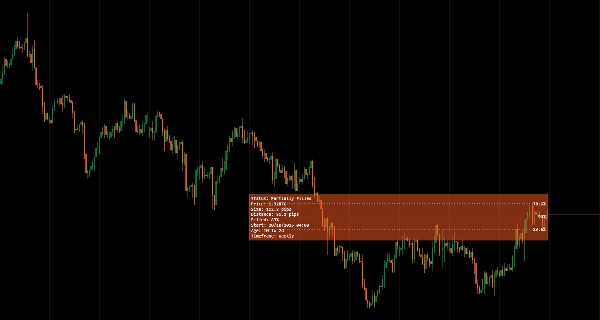
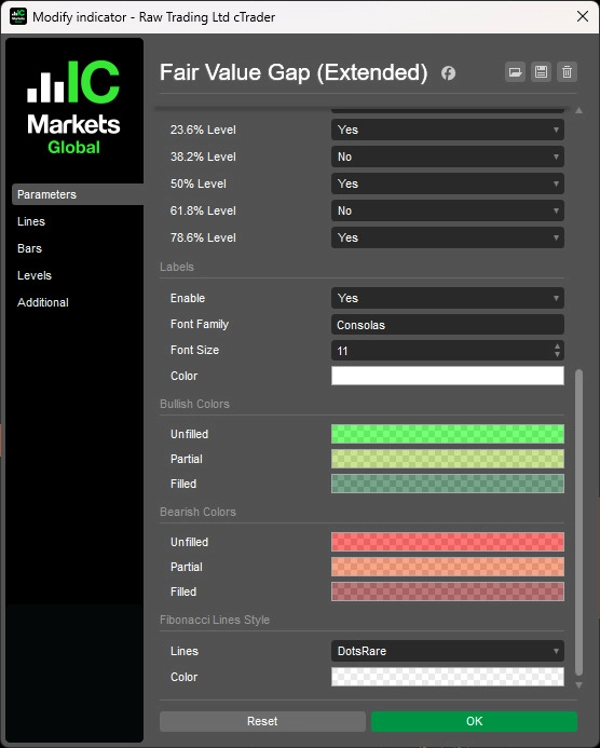
- Niveles automáticos de Fibonacci (23.6%, 38.2%, 50%, 61.8%, 78.6%) mostrados en FVGs parciales y llenados
- Elimina la necesidad de dibujar niveles manualmente
- Zonas de entrada precisas dentro de los gaps
- Estrategias de entrada basadas en Fibonacci simplificadas
Modo Multitemporal
- Escanea y muestra FVGs de marcos temporales superiores en gráficos de marcos temporales inferiores
- Alinea gaps estructurales de HTF con la acción del precio en LTF
- Mejora el flujo de trabajo de análisis multitemporal
Mostrar Todos los FVGs
- Establece "FVG to Display" en -1 para mostrar todos los FVGs históricos sin límite
- Visibilidad completa del comportamiento de los gaps en tu gráfico
- Rastrea patrones de llenado de gaps a lo largo del tiempo
Interfaz Limpia y Minimalista
- Etiquetas no intrusivas diseñadas para claridad
- Informativo sin saturar la vista del precio
- Presentación profesional para un análisis enfocado
__________________________________________________________________________________________
MÁS INDICADORES GRATUITOS
Explora una amplia gama de herramientas de análisis de mercado — desde estructura y volumen hasta regresión, volatilidad y marcos temporales personalizados.
El código fuente está disponible en el repositorio de GitHub repository.
Todos son gratuitos. Pero si quieres apoyar con un café, puedes hacerlo aquí.
Soporte/Resistencia
Volumen
- Volume Activity Profiler
- Volume Efficiency Analyzer
- Volume Profile Analytics
- Volume Profile - Updated
- Volume Spread Analysis
- VWAP (Precio Promedio Ponderado por Volumen)
Medias Móviles
- SSL Channel
- Anchored Moving Average
- Deviation-Scaled Moving Average
- Gann High Low Activator
- Instantaneous Trendline
- Kaufman Adaptive MA with Trend Vision
- Moving Average Channel
- Moving Averages Suite
- Trend Channel Moving Average
Utilidades/Personalizados
Basado en Regresión
Volatilidad
Osciladores
__________________________________________________________________________________________
DESCARGO DE RESPONSABILIDAD
El trading implica riesgos. Este indicador está destinado solo para análisis técnico — siempre aplica una gestión adecuada del riesgo y opera responsablemente.
RETROALIMENTACIÓN Y MEJORAS
Si tienes sugerencias, solicitudes de funciones o ideas para mejoras, por favor deja un comentario en la pestaña de Discusión. Tu retroalimentación ayuda a mejorar el indicador para todos.
Resumen
The indicator displays the precise age of each gap in years, months, weeks, and days, aiding traders in prioritizing fresh versus stale gaps. It projects five Fibonacci retracement levels (23.6%, 38.2%, 50%, 61.8%, 78.6%) on partial and filled gaps, providing predefined entry zones based on Fibonacci ratios without manual drawing.
Fair Value Gap (Extended) supports multi-timeframe analysis by scanning higher timeframe gaps and displaying them on lower timeframe charts, facilitating alignment of structural gaps with price action. It offers options to extend filled gap boxes to the current bar and to display unlimited historical gaps for comprehensive gap behavior tracking.
The indicator features a clean, minimal user interface with non-intrusive labels, delivering clear liquidity imbalance insights for traders focusing on gap fills and Fibonacci-based entries.
Valoraciones de clientes
5 | 100 % | |
4 | 0 % | |
3 | 0 % | |
2 | 0 % | |
1 | 0 % |